
Supply and demand zones are areas where gold moved away fast. They show you where buyers or sellers were strong before, and may be again.
What it is
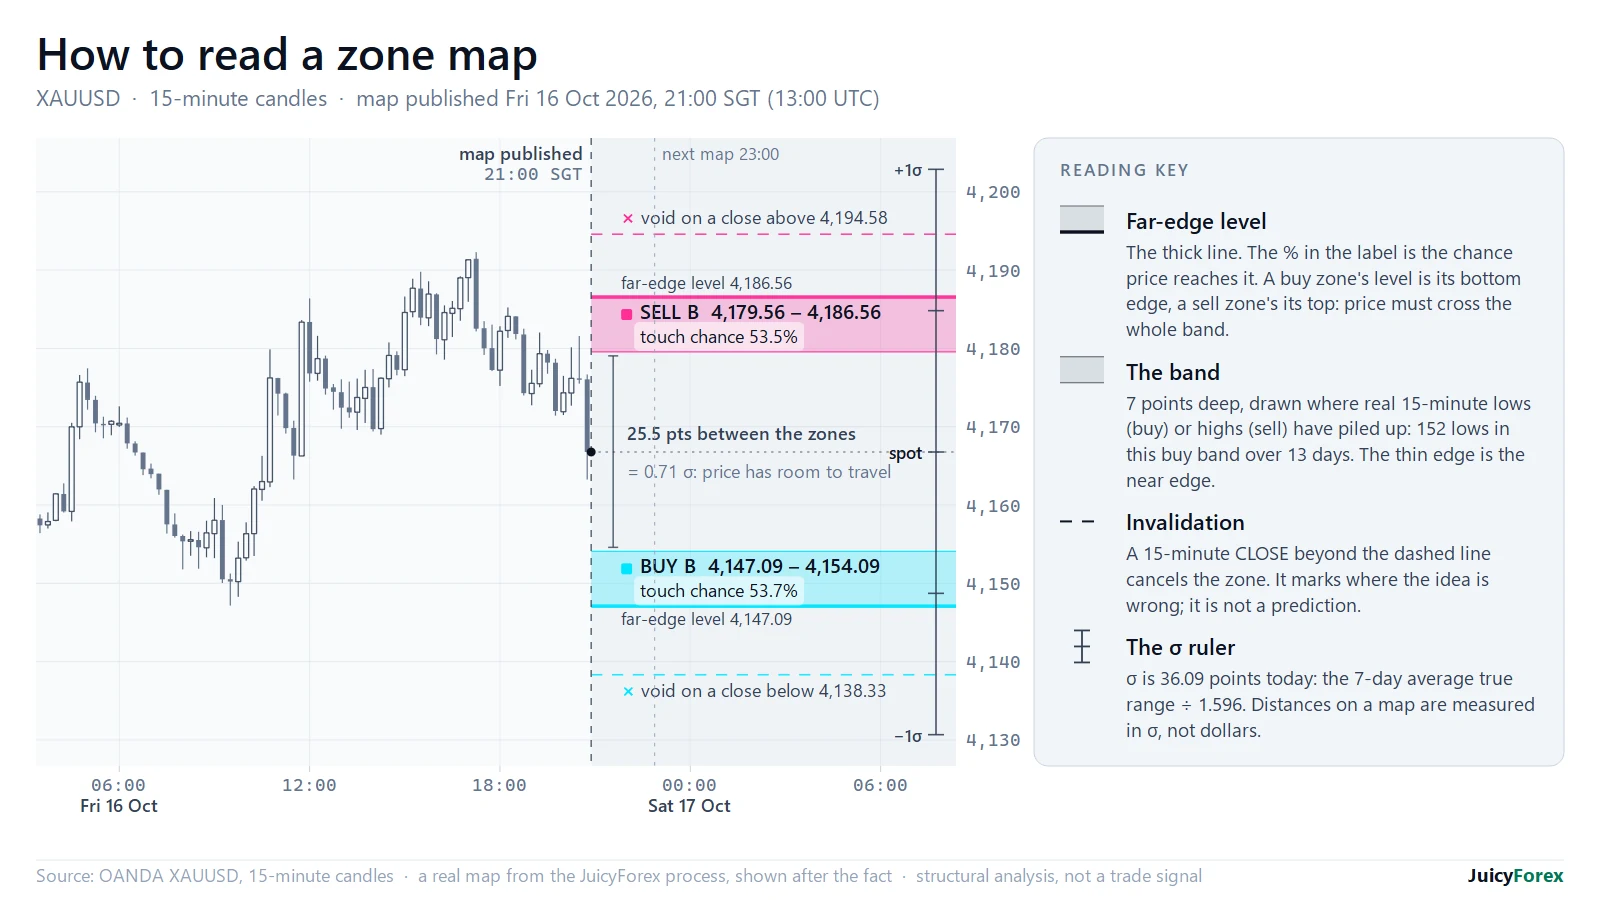
A demand zone is a price area where gold paused, then rose sharply. A supply zone is the opposite: gold paused, then fell sharply. You mark each one as an area, not a single line.
The quicker price leaves, the stronger the zone. A zone that price has not revisited is called fresh. Each return usually weakens it.
How you use it on gold
Gold reacts strongly to news and to the London and New York opens, so many good zones appear there. Before you use a zone, ask three questions: how fast did price leave, how far did it go, and how long ago was it? If price closes clearly through a zone, it is no longer valid. That line is also where you place your stop-loss.
What you will learn
- Marking zones from the base and the move away
- Ranking zones by strength and freshness
- Using higher timeframes to pick the zones that matter
- Placing your stop-loss at the invalidation line
- Combining zones with volume and structure
One mistake to avoid
Drawing too many zones. A chart full of boxes explains everything afterwards and helps with nothing beforehand. Keep only the few zones that pass your checklist, and ask what would make each one wrong.
YouTube or learning with us?
Supply and demand is everywhere on YouTube. Some channels teach the basics free and charge for the advanced level.
Pros
- Plenty of free examples.
- Good for a first look at the idea.
Cons
- Every teacher draws zones differently.
- Failed zones are rarely shown.
- The ranking and invalidation rules are often saved for the paid course.
How we teach it
We use one written checklist, so you draw zones the same way every time. You also study losing zones as closely as winning ones.
- A clear checklist for strength, freshness and location
- A view-only investor password, so you can compare our zones with our trades
We are paid for this program, so check us against our live trading through the investor password.
Keep in mind
Zones are probabilities, not promises. A strong zone can fail, so size every trade so that one loss cannot hurt you. A simple way to start: open a daily chart of gold, mark the two or three strongest zones you can see, and write down what would make each one wrong. Do this for a week before you trade any of them.
Next: read our free market structure guide, then see the mentoring plans on the home page.
Gold (XAUUSD) and CFD trading carries a high risk of loss and is not suitable for everyone. Signals are general information, not personal advice, and do not guarantee results. Past performance does not guarantee future results. Only trade money you can afford to lose.