

A moving average smooths price by averaging the last N closes into one line, which makes the trend easier to see. A simple moving average (SMA) weights every close equally. An exponential moving average (EMA) weights recent closes more, so it reacts faster. Common periods are 20, 50 and 200. They lag, because they are built entirely from past prices.
What a moving average is
A moving average takes the average of a set number of recent closing prices and plots it as a line that updates each period. Because it blends many candles into one value, it filters out the jitter and leaves the underlying direction.
It answers one question well: which way is price trending, and how strongly? A rising average means recent prices are higher than older ones. It is the simplest trend tool, which is why it is so widely used.
SMA versus EMA
The SMA gives every close in its window equal weight. It is smooth and steady but slow to turn. The EMA weights the most recent closes more heavily, so it hugs price and reacts faster.
Neither is better in the abstract. The EMA turns sooner, which helps in fast trends but gives more false signals in chop. The SMA is calmer but later. Pick one, learn its behaviour, and stay consistent rather than switching after every losing trade.
The periods traders use
- 20: tracks the short-term trend and hugs price closely.
- 50: the standard medium-term trend gauge.
- 200: the widely watched long-term line that separates broad bull and bear conditions.
Many traders watch the 50 and 200, so price often reacts around them. It is another partly self-fulfilling effect, like support and resistance.
How to use them
There are two honest uses.
- Trend filter. Take long setups only while price is above a rising average, and shorts while it is below a falling one. This one rule keeps many beginners out of counter-trend trades.
- Dynamic support and resistance. In a trend, price often pulls back to an average, such as the 20 or 50 EMA, and resumes. That pullback is a cleaner entry than chasing an extended move.
Crossovers
When a faster average crosses a slower one, it marks a shift in momentum. The golden cross (50 crossing above the 200) and the death cross (50 below the 200) are long-term signals watched market-wide.
Crossovers are simple but late. By the time they trigger, much of the move can be done. They work better as trend confirmation than as precise entries, and they whipsaw badly in ranging markets.
The main limitation: lag
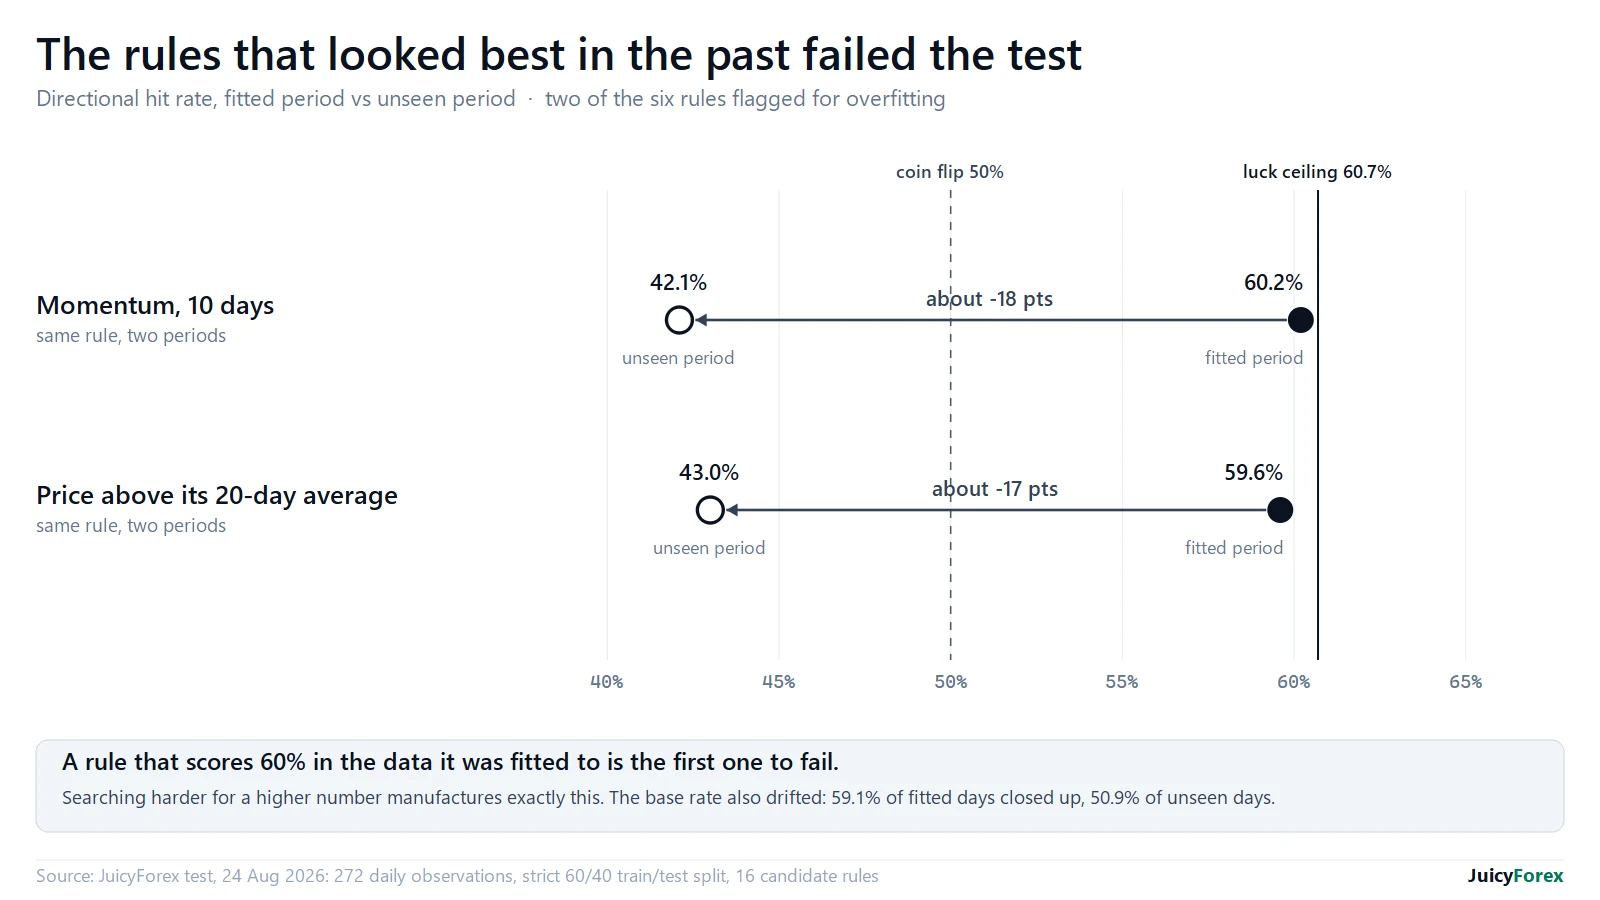
Every moving average is built from past prices, so it always lags the present. In a strong trend that lag is tolerable. In a sideways market it produces a stream of false crossovers and fake support. A moving average cannot tell you a range from a trend. You have to.
Treat averages as context, not signals. Combine one with structure and a trigger, size the trade from your stop, and never trade a crossover just because it happened.
Questions
What are the best moving average periods?
The 20, 50 and 200 are the most widely used, for short, medium and long-term trend. The 50 and 200 are watched market-wide.
What is the main weakness of moving averages?
Lag. They are built from past prices, so they trail the present and give false signals in sideways markets. They confirm trend rather than predict it.
70–80% of retail investor accounts lose money trading CFDs. This page is education, not advice. All trade examples are constructed composites.