

The Relative Strength Index (RSI) is a momentum oscillator between 0 and 100 that measures the speed of recent price changes. Readings above 70 are called overbought and below 30 oversold. The biggest beginner error is treating those as automatic sell and buy signals. Its most useful application is divergence, which shows weakening momentum.
What the RSI is
The RSI was developed by J. Welles Wilder. It measures the speed and size of recent price moves and expresses them as one number from 0 to 100. High values mean recent gains have dominated. Low values mean recent losses have. The standard setting looks back 14 periods.
It is a momentum tool, not a price tool. It tells you how forcefully price has been moving. That differs from where price is, or which way the trend points.
How it is calculated
You do not need the formula, but the idea helps. RSI compares the average size of up-closes with the average size of down-closes over the lookback, then scales the ratio to 0–100. A reading of 50 means up and down momentum are roughly balanced.
Like every indicator, RSI is derived entirely from past price. It adds a lens, not new information.
Overbought and oversold: the trap
The textbook reading is that above 70 you expect a fall and below 30 you expect a rise. In a ranging market that can work. In a trending market it is a trap. A strong uptrend can pin RSI above 70 for a long time while price keeps climbing.
Overbought means momentum is strong, not that a reversal is due. Shorting an uptrend because RSI hit 70 is one of the fastest ways to lose money with an indicator. Read the levels in the context of the trend.
Divergence
Divergence is where RSI earns its keep. Price makes a higher high but RSI makes a lower high: bearish divergence. Price makes a lower low but RSI makes a higher low: bullish divergence. The new extreme was reached with less momentum than the last.
It warns that a trend is tiring. It is not a precise entry. Use it to anticipate a possible turn near a level, then wait for a real trigger before you act.
Using RSI with the trend
A more robust approach uses RSI to time pullbacks with the trend. In an uptrend, a dip in RSI toward 40–50 can flag a buying opportunity as momentum resets, rather than a top.
The centreline matters too. Momentum above 50 broadly favours buyers and below 50 favours sellers. Aligning RSI with the higher-timeframe trend beats fighting it at the extremes.
Settings and common mistakes
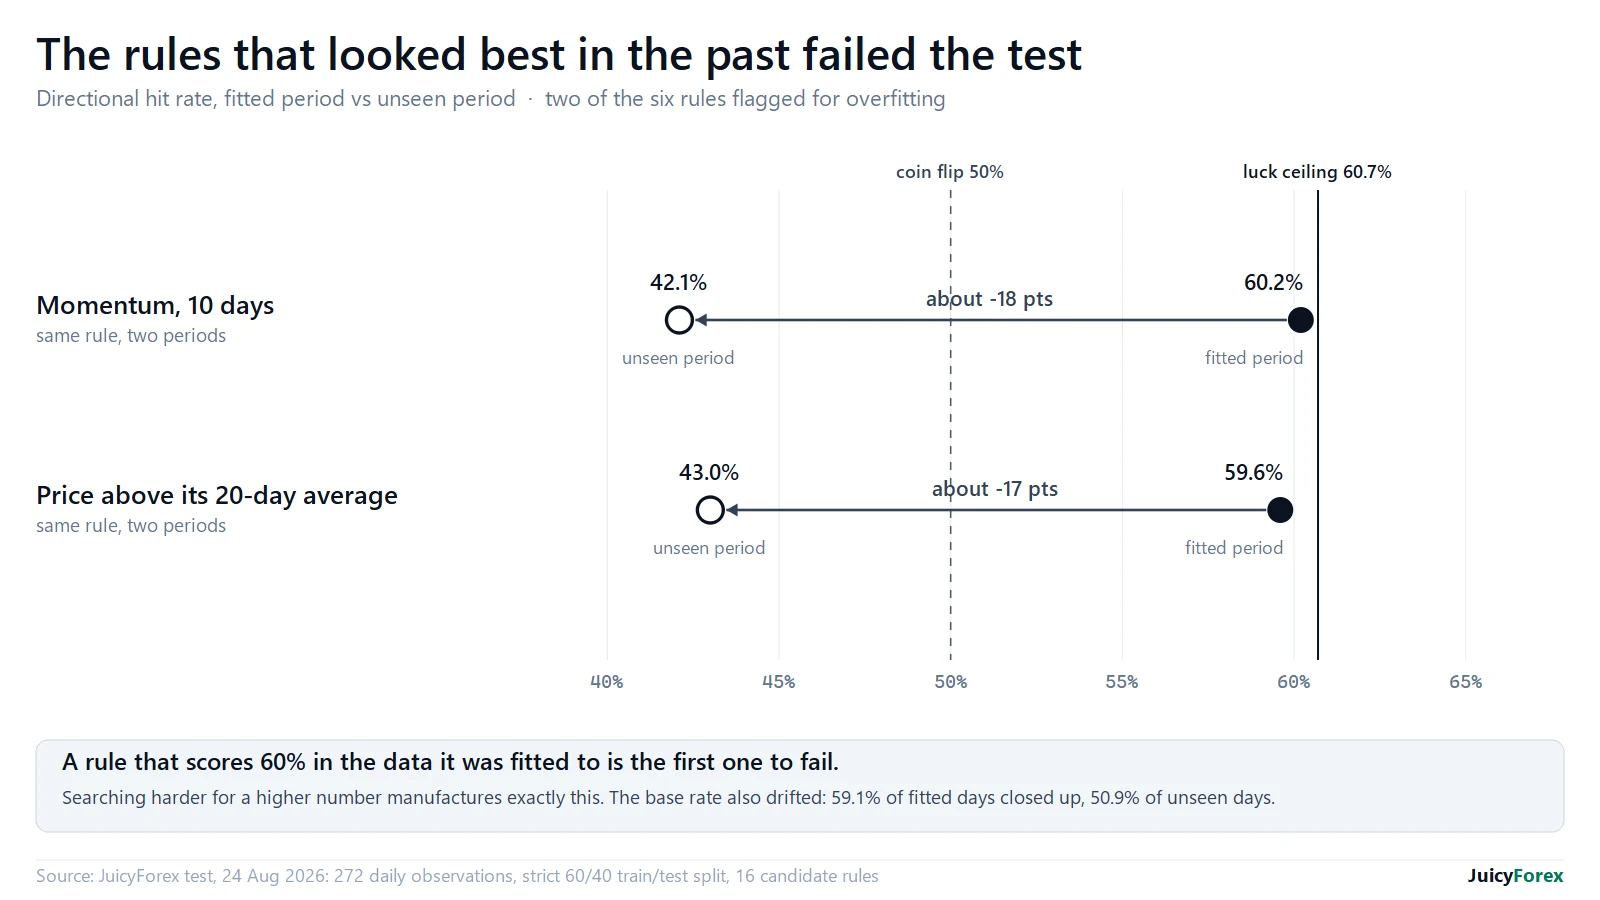
The default 14 is fine. Shorter settings are noisier and longer ones smoother. Do not tune endlessly, because a period that looks perfect on past data usually fails going forward. The bigger mistakes are conceptual: trading overbought and oversold against a trend, and treating RSI as a standalone system.
RSI is one input. Combine it with structure and price action, and size every trade from the stop.
Questions
Is RSI above 70 a sell signal?
No. Above 70 means momentum is strong. In an uptrend RSI can stay there while price keeps rising. Selling against the trend because RSI hit 70 is a common, costly mistake.
What is the best RSI setting?
The default 14 periods is sensible. Over-tuning to past data usually fails going forward. The setting matters far less than using RSI with the trend.
70–80% of retail investor accounts lose money trading CFDs. This page is education, not advice. All trade examples are constructed composites.