

Support is a price area where buying has previously been strong enough to stop a fall. Resistance is where selling has stopped a rise. They work partly because traders remember these levels and act at them again. Draw them as zones, not exact lines, using prior swing highs and lows. Once broken, old resistance often becomes new support, and the reverse.
What support and resistance are
Markets do not move in straight lines. They stall and reverse at prices that mattered before. Support is a level below the current price where buyers have stepped in and halted a decline. Resistance is a level above where sellers have halted an advance.
They are the most basic form of market structure, the map of where price has reacted.
Why they work
Enough traders watch the same obvious prices and act at them, so their collective behaviour makes the level matter. The logic is partly circular, but very real. Memory of a prior high, resting orders and stop placement all cluster around the same areas.
Levels are probabilities, not walls. A level that has held three times is respected, but every level eventually breaks. Treat support and resistance as places where the odds of a reaction rise, not as guarantees.
How to draw them
- Use swing highs and lows. Mark the peaks and troughs left after a reversal. Connect those that line up horizontally. More independent touches make a level more significant.
- Start on higher timeframes. A level on the daily chart matters more than one on the 5-minute.
- Draw zones. Price rarely reverses at the exact pixel, and wicks poke through. Draw a band from the wicks to the bodies. You are waiting for a reaction in an area, and a one-pip overshoot will not shake you out.
The numbers behind zones
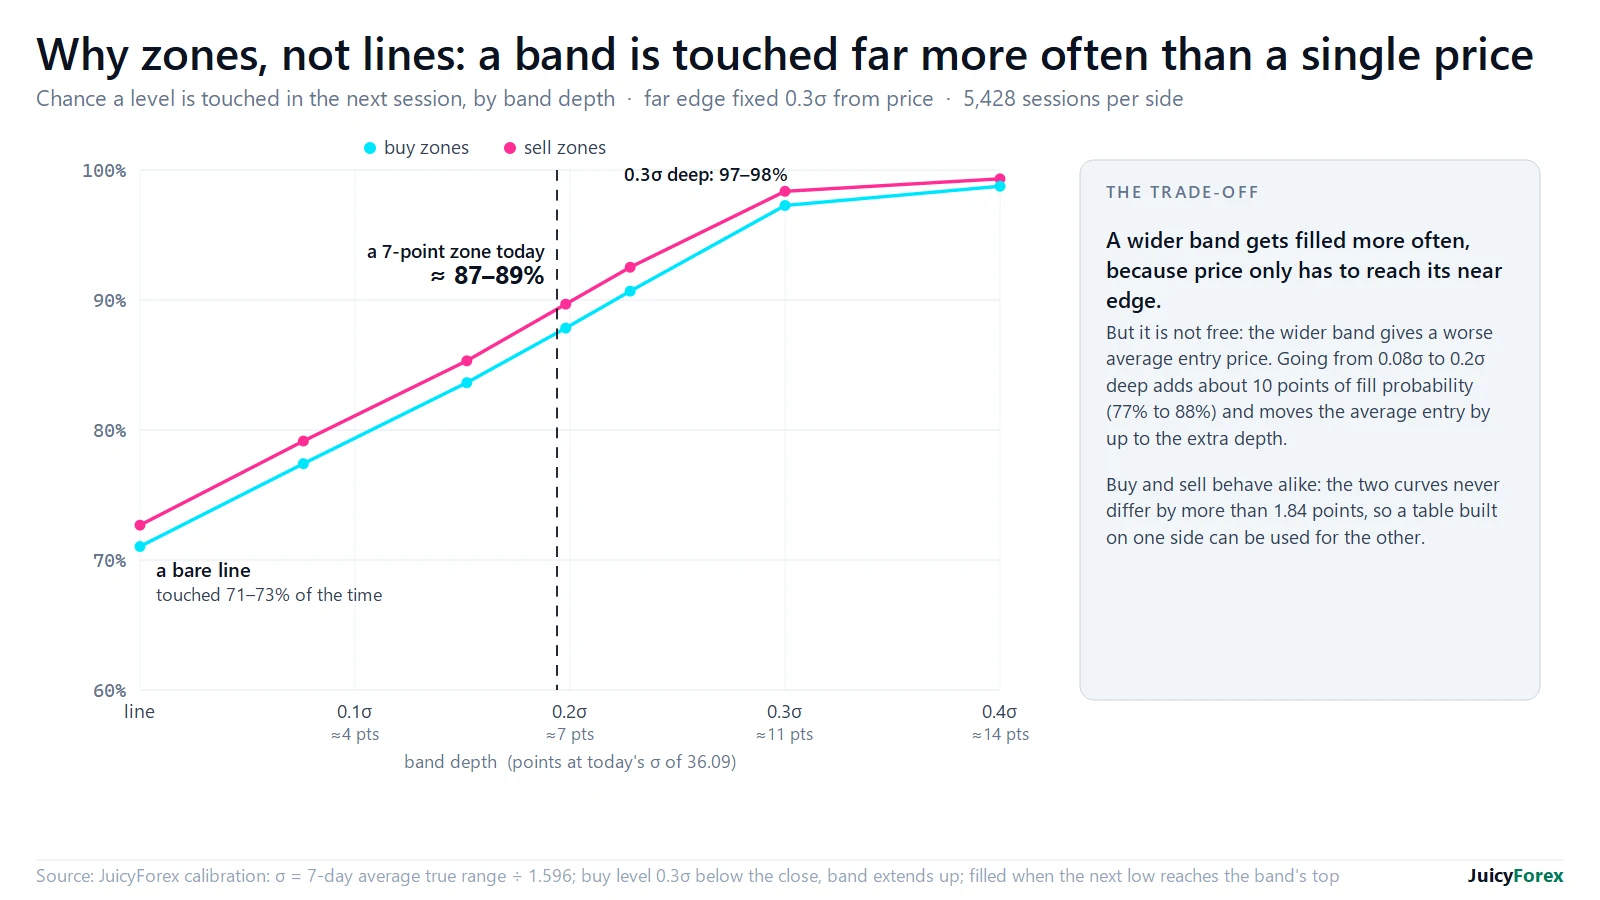
We measured it. Set a level 0.3σ from the prior close, where σ is the average daily range divided by 1.596. Across every session since 2009, Sunday evenings included, a bare line was touched in 71% of the next sessions. A band 0.2σ deep was touched in 88-90%, and one 0.3σ deep in 97-98%.
Zones are measurably more likely to be reached, at the cost of a worse average entry. See a real zone map in how to read a gold zone map.
Role reversal
The most useful behaviour of these levels is that they flip. When price breaks below support, that old support frequently becomes new resistance on a retest. Broken resistance becomes new support.
This gives you higher-quality entries. Rather than guessing a breakout, you wait for price to break a level, then retest it from the other side, and enter where the flip confirms.
How to trade them
There are two honest approaches. For reversals, look for a reaction, for example a candlestick signal, as price reaches a strong zone, with a stop beyond it. For breakouts, trade the move through a level, ideally on the retest, using role reversal as confirmation.
Either way, the level defines your risk. Your stop sits just beyond the zone, and that distance sizes the position. A level is not a signal on its own. It is the place where a signal becomes worth taking.
Questions
Why does support become resistance?
When price breaks below support, traders who bought there are at a loss and tend to sell on a retest. Breakout sellers defend it too. This is role reversal.
Are support and resistance reliable?
They raise the probability of a reaction but never guarantee one. Every level eventually breaks, so define risk with a stop beyond the zone.
Should they be lines or zones?
Zones. Price reverses within a small range and wicks overshoot exact prices, so a band is more realistic.
70–80% of retail investor accounts lose money trading CFDs. This page is education, not advice. All trade examples are constructed composites.