The short answer
Forex technical analysis is the study of price behaviour to identify where orders are likely resting and how price reacts on reaching them. It is built in layers: market structure (higher highs and higher lows, or lower highs and lower lows) establishes direction; support and resistance identify decision levels; candlesticks record what happened at those levels; indicators measure momentum and volatility but add no new information. Analysis is probabilistic, never predictive — it estimates the odds of a scenario, not its certainty. Around 70–80% of retail accounts lose money, and analysis is rarely the cause.
Prerequisites: The Complete Beginner Forex Trading Guide. You must be able to calculate a lot size before this page will help you.
Key Takeaways
- Technical analysis is not prediction. It is the study of where orders rest, and how price behaves when it reaches them. Reframed that way, the whole discipline becomes coherent.
- Structure first, always. An RSI reading of 30 in a strong downtrend means the downtrend is healthy. The same reading at range support means the opposite. Indicators have no meaning independent of context, and structure is the context.
- Every indicator is a transformation of price. None contains information price does not. Stacking six does not give you six confirmations — it gives you six correlated views of one dataset, and an unearned feeling of certainty.
- A candlestick pattern is a sentence. Location is the paragraph. Structure is the book. The same pin bar is meaningful at a weekly high and noise in mid-range.
- Levels are zones, not lines. Institutional orders are distributed across a band, not placed at one decimal. Traders drawing hairline levels get stopped by noise and call it manipulation.
- Support and resistance fail when the market's reason for respecting them disappears — almost always a fundamental catalyst. A six-month level means nothing thirty seconds after a surprise Fed statement.
- ATR is the most underrated tool in retail trading because it answers the only question that matters at entry: how far can this move against me while still being wrong-but-normal?
- Confluence means independent methods agreeing. Three moving averages agreeing is not confluence. It is redundancy wearing a costume.
Quick Summary
This guide teaches technical analysis in the order a professional builds it, which is close to the reverse of how it is usually taught.
We begin with what technical analysis actually is and why it works at all. Then market structure — the skeleton beneath everything else. Then support and resistance, drawn properly, with an honest account of why they fail. Then trend, breakout and pullback, including the anatomy of a false breakout, which is where most retail money is lost.
Only then do we reach candlesticks, treated as records rather than signals, and chart patterns, treated with more scepticism than you will find elsewhere.
Then indicators — moving averages, RSI, MACD, Bollinger Bands, ATR, volume — each with a section on what it actually measures, its legitimate use, and precisely how it is misused. Then divergence, confluence, and multi-timeframe analysis.
We close with eight annotated case studies, including three losing trades, a professional workflow, a checklist, a cheat sheet, and a glossary.
No indicator settings are presented as optimal. If a resource tells you RSI(9) beats RSI(14), it is selling curve-fitting as insight.
Trading forex on margin carries a high risk of loss. Nothing here is financial advice.
What Is Technical Analysis in Forex?
Technical analysis is the study of where orders are likely resting and how price behaves on reaching them. It is built in layers: market structure establishes direction, support and resistance identify decision levels, candlesticks record what happened there, and indicators measure momentum. It estimates probability, never certainty.
Ask ten traders to define technical analysis and nine will say something about predicting price from historical data.
That definition guarantees failure, because it sets an impossible standard and then measures you against it.
Here is a better one:
Technical analysis is the study of where orders are likely to be resting, and how price behaves when it arrives there.
Reframe everything through that lens and the discipline stops being mystical.
A support level is not magic. It is a price where buyers previously transacted in size. Some of their limit orders may still rest there. Traders who missed the last bounce have orders waiting. Short sellers who entered above have stops sitting just below. When price returns, it meets a concentration of buy orders — and if it breaks through them, it meets a cascade of triggered stops that accelerate the move.
A pin bar is not a signal. It is a record: price extended into an area, was rejected, and closed near its open. Sellers overwhelmed buyers within that period. Whether that matters depends entirely on where it happened.
A moving average is not a prediction. It is an arithmetic mean, and it matters only because thousands of participants watch the same one, which makes it a self-referential decision point.
Everything in technical analysis reduces to one of three questions:
- Where are the orders? (Levels, structure, liquidity pools)
- What happened when price reached them? (Candlesticks, volume, rejection)
- What is the broader context? (Trend, timeframe alignment, volatility regime, fundamentals)
Notice that "what will happen next" is not on the list. It is not answerable, and the traders who make money have stopped asking.
The three assumptions, examined honestly
Classical technical analysis rests on three premises. They are usually presented as gospel. They deserve scrutiny.
"The market discounts everything." Broadly true and useful. Price reflects the aggregate of all known information and every participant's positioning. But it is a lagging aggregation. Price discounts everything currently known — it discounts nothing about the CPI print in forty minutes.
"Price moves in trends." Partially true. Price trends perhaps 30% of the time and ranges the rest. Trend-following systems are unprofitable during the majority period, which is precisely why they require the discipline to survive it.
"History repeats." The weakest of the three, and the most abused. History does not repeat. Human behaviour under uncertainty repeats, because the neurology producing it is stable. Fear, greed, loss aversion and herding produce recurring shapes in price. The shapes are downstream of the behaviour. This distinction matters, because when the behaviour changes — when algorithms replace humans at a certain scale, as they have — the shapes change too.
Why It Works — and Where It Doesn't
The honest case for technical analysis
Reflexivity. Enough participants watch the same levels that the levels acquire genuine causal power. The 200-day moving average matters partly because it is a moving average and mostly because everyone is looking at it. This is circular, and it is real.
Order clustering. Stops and limits genuinely cluster around round numbers, prior swing points, and session highs and lows. That is not a theory. It is a structural fact about how humans and algorithms place orders, and it produces exploitable behaviour when price arrives.
Volatility regimes persist. Volatility clusters. Quiet begets quiet; violent begets violent. This is one of the most robust findings in all of financial econometrics, and it is why ATR-based stops are more defensible than fixed ones.
The honest case against
It is not predictive. Not once. Not ever. Every setup is a probability distribution, and a favourable distribution still loses frequently.
Patterns are found in random data. Feed a chartist a random walk and they will identify head and shoulders formations. This is a real experimental finding, and it should make you humble. Pattern recognition is not evidence of a pattern. Your brain is a pattern-detection engine with essentially no false-positive brake.
Fundamentals override everything, instantly. A perfect technical short into resistance is worthless if the ECB turns hawkish four minutes later. Technicals describe the terrain. Fundamentals move it.
Backtested edges decay. As a pattern becomes widely known, it is arbitraged. Some classical patterns that worked in the 1980s have measurably weaker performance now.
What Is Market Structure in Trading?
Market structure is the sequence of swing highs and lows that defines whether price is trending or ranging. An uptrend makes higher highs and higher lows; a downtrend makes lower highs and lower lows. A break of structure occurs when price violates the swing point that defined the trend.
Full guide: Market structure and liquidity, explained
Everything else is decoration. Learn this first, and spend a month on it alone.
The definitions
- Uptrend — a sequence of higher highs (HH) and higher lows (HL).
- Downtrend — lower highs (LH) and lower lows (LL).
- Range — neither. Price oscillates between horizontal boundaries.
UPTREND DOWNTREND RANGE
HH LH ────────────── resistance
/ \ \ /\ /\ /\
/ \ HH \ LH / \ / \ / \
/ \ / \ \ / \ / \/ \/ \
/ HL/ \ \/ \ / \
HL LL \ ────────────── support
LL
That is the whole framework. It has no settings, no lag, and it works on every instrument and every timeframe ever created.
Break of structure (BOS)
An uptrend is intact while it makes higher highs and higher lows. It is broken when it makes a lower low — that is, when price violates the swing low that produced the last higher low.
HH
/ \ LH
/ \ / \
/ \ / \
/ HL / \
/ ← this low held \
\
────── ← price breaks below the HL
BREAK OF STRUCTURE
A BOS does not guarantee a reversal. It signals that the prior trend's mechanism has failed. Buyers who defended that low were overwhelmed. Something changed.
The professional response to a BOS is not "reverse immediately." It is "my directional bias is suspended until new structure forms." The trader who flips instantly on every BOS gets whipsawed to death in ranges, where BOS occurs constantly and means nothing.
Swing points, defined precisely
Ambiguity here causes endless confusion, so let us be exact.
A swing high is a candle whose high is higher than the highs of the n candles either side of it. A swing low is the inverse. Most traders use n = 2 or 3.
This matters because "the last high" is not obvious on a messy chart, and two traders will disagree. Define your n, apply it mechanically, and your structure reading becomes reproducible — which means it becomes testable, which means it becomes a strategy rather than an opinion.
Internal vs external structure
Higher timeframe structure is external. Lower timeframe structure inside it is internal.
A pullback in a daily uptrend is, on the M15 chart, a full downtrend — lower highs and lower lows, all the way down.
Both are true simultaneously. The M15 trader shorting that pullback is trading with internal structure and against external structure. That is not automatically wrong, but they must know they are doing it, because the trade has a shorter runway and a worse reward profile.
Beginners get destroyed by confusing the two. They see the M15 downtrend, conclude the market is bearish, and short into a daily uptrend at the exact level where institutional buyers are waiting.
How Do You Identify Support and Resistance?
Draw zones, not lines, roughly 0.5 × ATR wide. Significance comes from the size of the reaction a level produced, the timeframe it appears on, and its recency — not from the number of touches. Each touch consumes resting orders, so a level touched six times is a level about to break.
Full guide: How to draw support and resistance correctly
Levels do not exist because you drew a line. They exist because of transacted volume and resting orders.
What makes a level significant
Reaction magnitude. A level that produced a 300-pip reversal matters more than one that produced 20. The size of the reaction tells you the size of the orders that were there.
Timeframe. A weekly level dwarfs an M15 level. Always. It represents more participants over more time.
Recency. A level from four months ago is weaker than the same level from four days ago. Order books refresh.
Number of touches — with an important caveat.
Conventional wisdom: more touches = stronger level.
This is backwards. Each touch consumes the resting orders. A level touched six times has had its buy-side liquidity eaten five times. The seventh touch frequently breaks — and it breaks precisely because it looks so reliable that everyone has placed their stops just beyond it.
The strongest levels are those touched two or three times with strong reactions, not the ones with a decade of respect.
Confluence. A horizontal level that coincides with a trendline, a 61.8% Fibonacci retracement, a round number and the prior week's high is not four signals. It is one location that many different participants are watching for four different reasons — which means more orders are resting there. That is the actual mechanism, and it is worth understanding rather than reciting.
Drawing them correctly
Zones, not lines.
Institutional orders are not placed at 1.09000 exactly. They are distributed across 1.0895–1.0905. Draw a rectangle. A reasonable width is roughly 0.5 × ATR on your analysis timeframe.
Traders who draw hairline levels get stopped out by ordinary noise, conclude their broker is hunting them, and never recover from the belief.
Use bodies or wicks?
Both, differently. Wicks show where price was rejected — the extremity of the auction. Bodies show where price accepted and closed. Draw your zone from the cluster of bodies to the extremity of the wicks. That band is where the fight happened.
Fewer levels.
A chart with twenty levels has no levels. If everything is significant, nothing is. Mark three to five per timeframe. If you cannot decide which matter, you have not yet learned to see reaction magnitude.
Why levels fail
They fail when the reason the market respected them disappears.
That reason is almost always fundamental. A level that held for six months means nothing thirty seconds after a surprise Fed statement, because the participants who were defending it have re-priced. Their limit orders were placed under a set of assumptions that no longer holds. They pull them.
This is why event-blind technical analysis is dangerous. Check the calendar before you trust a level. A support zone into a CPI release is not a support zone. It is a place where you will discover what the CPI number was.
Support becomes resistance (and why)
The classic flip. Price breaks below support; the old support becomes resistance on the retest.
The mechanism is behavioural and precise:
- Traders who bought at that support are now underwater. Many will exit at breakeven if price returns — creating sell orders at that level.
- Traders who sold the break and missed will add on a retest — more sell orders.
- Traders who shorted at the break will place stops just above the old level, creating a defended boundary.
Three independent groups produce selling at the same price for three different reasons. That is why the flip works. Not because "old support becomes resistance" is a rule, but because of who is standing there and what they are trying to do.
Trend
Identifying trend without indicators
You do not need a moving average to see a trend. Structure is sufficient and it is not lagging.
Full guide: Trend following: trading with the dominant direction
- Higher highs and higher lows → uptrend. Trade long.
- Lower highs and lower lows → downtrend. Trade short.
- Neither → range. Trade the boundaries or stand aside.
Moving averages tell you the same thing, twenty candles late.
Trend strength
Not all uptrends are equal. Assess:
Impulse-to-correction ratio. In a strong trend, moves with the trend (impulses) are large and fast; moves against it (corrections) are small and slow. When corrections start matching the size of impulses, the trend is weakening. This is visible without a single indicator, and it is the earliest reliable warning available.
Depth of pullbacks. Shallow pullbacks (retracing under 38.2%) indicate aggressive buyers unwilling to wait for better prices. Deep pullbacks (past 61.8%) indicate hesitation.
Slope consistency. A trend accelerating into a near-vertical slope is not strong. It is exhausted. Parabolic moves end abruptly, because they are driven by participants who bought out of fear of missing out, and those participants have no conviction to hold.
The trend regime problem
Here is a truth that most education avoids: markets range roughly 70% of the time.
A trend-following system therefore spends most of its life losing small amounts. It survives on the 30% when trends occur, where its winners are large. The expectancy is positive; the experience is punishing.
A mean-reversion system does the opposite — it prints small wins continuously and then gives it all back in one trend, which arrives without warning.
Neither works in all conditions. No system does. The professional response is not to build a universal strategy, which is a fantasy sold to beginners. It is to identify the current regime, deploy the matching approach, and stand aside when neither applies.
The willingness to not trade for two weeks is worth more than any indicator ever devised. It is also the hardest thing on this page to actually do.
Breakouts, False Breakouts and Liquidity
This section is where most retail money is lost. Read it twice.
Full guide: Breakout trading and how to avoid false breaks
The naive breakout
Price approaches resistance. It breaks. You buy. Price reverses immediately and you are stopped.
This happens so consistently that beginners conclude the market is personally hostile. It is not. It is doing exactly what it is structured to do.
Where the stops are
Above an obvious resistance level sit:
- Stop losses of every short seller who entered at that resistance (buy orders).
- Buy stop orders of every breakout trader waiting to enter (buy orders).
That is a pool of resting buy orders sitting just above an obvious line, advertised to everyone with a chart.
Now: who needs buy orders? Anyone with a large sell order to fill.
A fund wanting to sell 400 million euros cannot simply hit the bid — they would move the market violently against themselves. They need counterparties. They need buyers. And there is a large, known, stationary pool of buyers sitting just above resistance.
So price is pushed above resistance. Retail stops trigger. Breakout traders buy. The fund sells into all of it. Price then collapses back below the level.
This is the liquidity sweep — colloquially, the stop hunt.
The anatomy of a false breakout
↑ sweep — takes stops, fills institutional sells
/\
──────────────/──\──────────────── resistance
/ \
/ \ ← closes back inside. THIS is the signal.
/ \
/ \
/ ↓
Three components, in order:
- The push — price closes above the level, or wicks convincingly through it.
- The failure — price closes back inside the range. This is the moment of information, and it is a close, not a touch.
- The move — price travels in the opposite direction, now with trapped breakout buyers becoming forced sellers, adding fuel.
The false breakout is one of the highest-probability structures in trading, precisely because it is powered by trapped traders. Their exits are your continuation.
Trading breakouts without being the liquidity
Method 1 — Wait for the close, not the touch. A wick through a level is nothing. A candle body closing beyond it on your analysis timeframe is information. This filters most sweeps at the cost of a worse entry price. That trade-off is almost always worth it.
Method 2 — Trade the retest. Let price break, then wait for it to return to the level and hold. Lower probability of participating in the initial move; far higher probability of not being trapped. A tighter stop, too, which improves reward-to-risk.
Method 3 — Trade the failure. Ignore breakouts entirely. Wait for the sweep-and-reclaim, and enter against the trapped crowd. Stop above the sweep wick, which is a genuinely precise invalidation level. This is the professional's preferred structure and it requires patience most traders do not have.
Method 4 — Require a catalyst. Breakouts that occur into a news release or at the London open have real order flow behind them. Breakouts at 03:00 UTC in the thin Asian session usually do not. Time of day is a filter, and it is free.
The Pullback
The highest-quality trade in trend trading, and the hardest to take, because by the time it looks safe it is over.
Why pullbacks exist
A trend does not move in a straight line, because:
- Traders in profit take some off. (Selling in an uptrend.)
- Traders who missed the move wait for better prices. (Buying, but lower.)
- New shorts try to fade the extension.
Price retraces until the sellers are exhausted and the waiting buyers step in.
Where pullbacks end
The honest answer is that nobody knows precisely. But areas of confluence attract them, and these are where you plan:
- The prior swing high, now support (structural flip).
- The 38.2% – 61.8% Fibonacci retracement of the impulse.
- A moving average that this instrument has recently respected — the 20 EMA on a fast trend, the 50 on a measured one.
- A round number.
- The point of control from the prior session, if you use volume profile.
When several of these cluster within a narrow band, that band is a high-probability reaction zone. Not because the tools are magic, but because different groups of traders are watching different tools and all arriving at the same price.
The pullback trade, in five steps
- Establish trend on the higher timeframe via structure. Higher highs, higher lows. No indicator required.
- Identify the zone where the pullback is likely to terminate — confluence of the above.
- Wait. Price must arrive. You do not chase it, and you do not decide it "probably won't come back."
- Require confirmation on a lower timeframe — a break of the pullback's internal structure, or a rejection candle at the zone. Entering on arrival alone is guessing.
- Stop below the zone, plus an ATR buffer. Not one tick below the low, where everyone else's stop is.
Position sizing then follows from the stop distance. That calculation is covered in the risk masterclass and is not repeated here.
Candlesticks: Records, Not Signals
What a candle actually tells you
Four numbers: open, high, low, close.
Full guide: Candlestick patterns: what they really tell you
- Body — the distance between open and close. Where price was accepted.
- Wicks — the extremes. Where price was rejected.
That is all. A candle is a compression of everything that happened in a period into four numbers. Useful, and lossy. A three-hour battle between buyers and sellers, and a five-minute institutional order, can produce identical candles.
The patterns worth knowing
Pin bar / hammer / shooting star. A long wick, small body. Price extended into an area and was rejected. The longer the wick relative to the body, the more decisive the rejection.
Engulfing. A candle whose body entirely engulfs the prior candle's body. It says: the period opened where the previous one closed, went against it, and closed beyond it entirely. Aggressive reversal of sentiment within one period.
Inside bar. A candle entirely within the prior candle's range. Contraction. Indecision. Often precedes an expansion, but tells you nothing about direction — which is why inside-bar strategies require a breakout trigger.
Doji. Open and close nearly equal. Equilibrium. Meaningless in the middle of nowhere; significant at the end of an extended move into a major level.
Marubozu. No wicks. Total, unopposed control by one side for the whole period.
The point that changes everything
A pin bar is not a sell signal. A pin bar is evidence.
Consider the identical bearish pin bar in four locations:
| Location | Interpretation | Tradeable? |
|---|---|---|
| At a fresh weekly high, after a 5-day rally, into a level that previously caused a 300-pip drop, at the London close | Sellers defended a significant level with force | Strong |
| At the top of a range, third touch, during the NY session | Consistent with range behaviour | Moderate |
| Mid-range, Tuesday afternoon, quiet session | Noise. Two participants disagreed briefly. | No |
| In a violent uptrend, immediately after a dovish Fed statement | Almost certainly a pullback in a repriced market | No — dangerous |
Same candle. Four completely different meanings.
The candle is the sentence. Location is the paragraph. Structure is the book. Any resource teaching you patterns without teaching you location is teaching you to read words and calling it literacy.
A note on pattern reliability
Some studies of candlestick patterns in isolation find performance close to random. This is not evidence that candlesticks are useless. It is evidence that candlesticks in isolation are useless — which is what this section has been arguing.
Filter the same patterns by structural location and trend context, and the results change materially. The pattern is a trigger, never a reason.
Chart Patterns, Honestly Assessed
Chart patterns deserve more scepticism than they receive. What follows is our assessment, labelled as such.
Full guide: Chart patterns, honestly assessed
| Pattern | What it represents | Our honest view |
|---|---|---|
| Head and shoulders | Failure to make a higher high, then a break of the low that supported it — i.e. a break of structure | Works, but only because it is a break of structure. Learn the structure; the pattern is a special case. |
| Double top / bottom | Two failures at one level, then a break of the intervening swing | Same. It is a level plus a BOS with a name. |
| Ascending / descending triangle | Compression against a flat boundary — one side is more aggressive | Reasonable. Direction bias is weaker than commonly claimed; the volatility expansion is the reliable part. |
| Flag / pennant | Shallow consolidation after an impulse | Genuinely useful. It is a pullback with a tidy shape. |
| Wedge | Converging trendlines, decreasing momentum | Weak. Highly subjective. Two traders draw two different wedges on the same chart. |
| Cup and handle | Rounded base, small pullback | Very subjective. Popular in equities. Weak in FX. |
The uncomfortable observation
Nearly every reliable chart pattern is a restatement of market structure or a level.
Head and shoulders is a lower high plus a break of structure. Double bottom is a level held twice plus a break of structure. Flags are pullbacks.
This is good news. It means you do not need to memorise thirty patterns. You need to read structure and levels, and the patterns will appear as consequences. A trader who understands structure sees a head and shoulders and thinks "lower high, then BOS" — which is more useful, because it generalises to the ninety-seven shapes that have no name.
The neckline problem
Every pattern-based entry depends on a subjective line. Draw the neckline through the wicks or the bodies? Two traders produce two entries, two stops, two outcomes.
Subjectivity is the enemy of backtesting. If you cannot define the pattern precisely enough that a stranger would mark the same one on the same chart, you cannot test it, and if you cannot test it, you do not know whether it has an edge. You have an anecdote and a feeling.
This is the strongest argument for structure over patterns: HH, HL, LH, LL are mechanically definable. A wedge is not.
Indicators: What They Actually Measure
The indicator paradox
Every indicator is a mathematical transformation of price. Not one contains information that price does not already contain.
RSI is a ratio of average gains to average losses. MACD is the difference between two exponential averages. Bollinger Bands are standard deviations around a mean. All of them take price in and produce a number out.
They can compress, smooth and normalise — genuinely useful, because it makes judgment consistent and testable. They cannot add.
Therefore:
Stacking six indicators does not give you six confirmations. It gives you six correlated views of a single dataset, and a powerful feeling of certainty that is entirely unearned. When RSI, MACD, Stochastic and CCI all agree, they have not independently verified anything. They are all measuring momentum, from the same prices, with slightly different arithmetic.
There is a strong inverse relationship between the number of indicators on a retail trader's chart and the size of their account. Complexity feels like rigour. It is usually a search for certainty, and certainty is not for sale here.
Lagging vs leading
All indicators lag. The "leading indicator" is a marketing term.
Oscillators (RSI, Stochastic) appear to lead because they can diverge from price before a reversal. But divergence is computed from price that has already printed. It lags less. It does not lead.
The only genuinely leading information is order flow — the resting orders in the book — and retail FX traders cannot see it.
The one honest use of indicators
Consistency.
"Is momentum weakening?" is a judgment. Two traders will disagree. "Is RSI making a lower high while price makes a higher high?" is a fact. Two traders will agree.
An indicator turns a subjective assessment into an objective, mechanical, backtestable condition. That is worth a great deal, and it is the only reason to use one.
Moving Averages
What it measures: the arithmetic mean of the last n closes (SMA), or a weighted mean favouring recent prices (EMA).
Full guide: Moving averages: what they measure and when they fail
Legitimate uses
Trend filter. "Only take longs when price is above the 200 EMA." Crude, mechanical, testable. It will not improve a bad system, but it stops a trend system from fighting a dominant trend, which is where its worst losses come from.
Dynamic support and resistance. In strong trends, price frequently retraces to the 20 or 50 EMA. This works for the reflexive reason: enough traders watch these that their orders cluster there. The 20 EMA works in fast trends, the 50 in measured ones. Neither works in ranges — where price crosses them constantly and meaninglessly.
Slope as regime detector. A flat 200 EMA means no trend. Do not run a trend system. This is one of the most useful and least discussed applications.
How it is misused
Crossover systems as standalone entries. "Buy when the 50 crosses above the 200." By construction, this signal arrives long after the move began. In backtests it produces a low win rate with occasional large winners — genuinely positive expectancy in trending decades, and a slow bleed otherwise. Most traders lack the temperament to survive its drawdowns, and quit before the trend that pays.
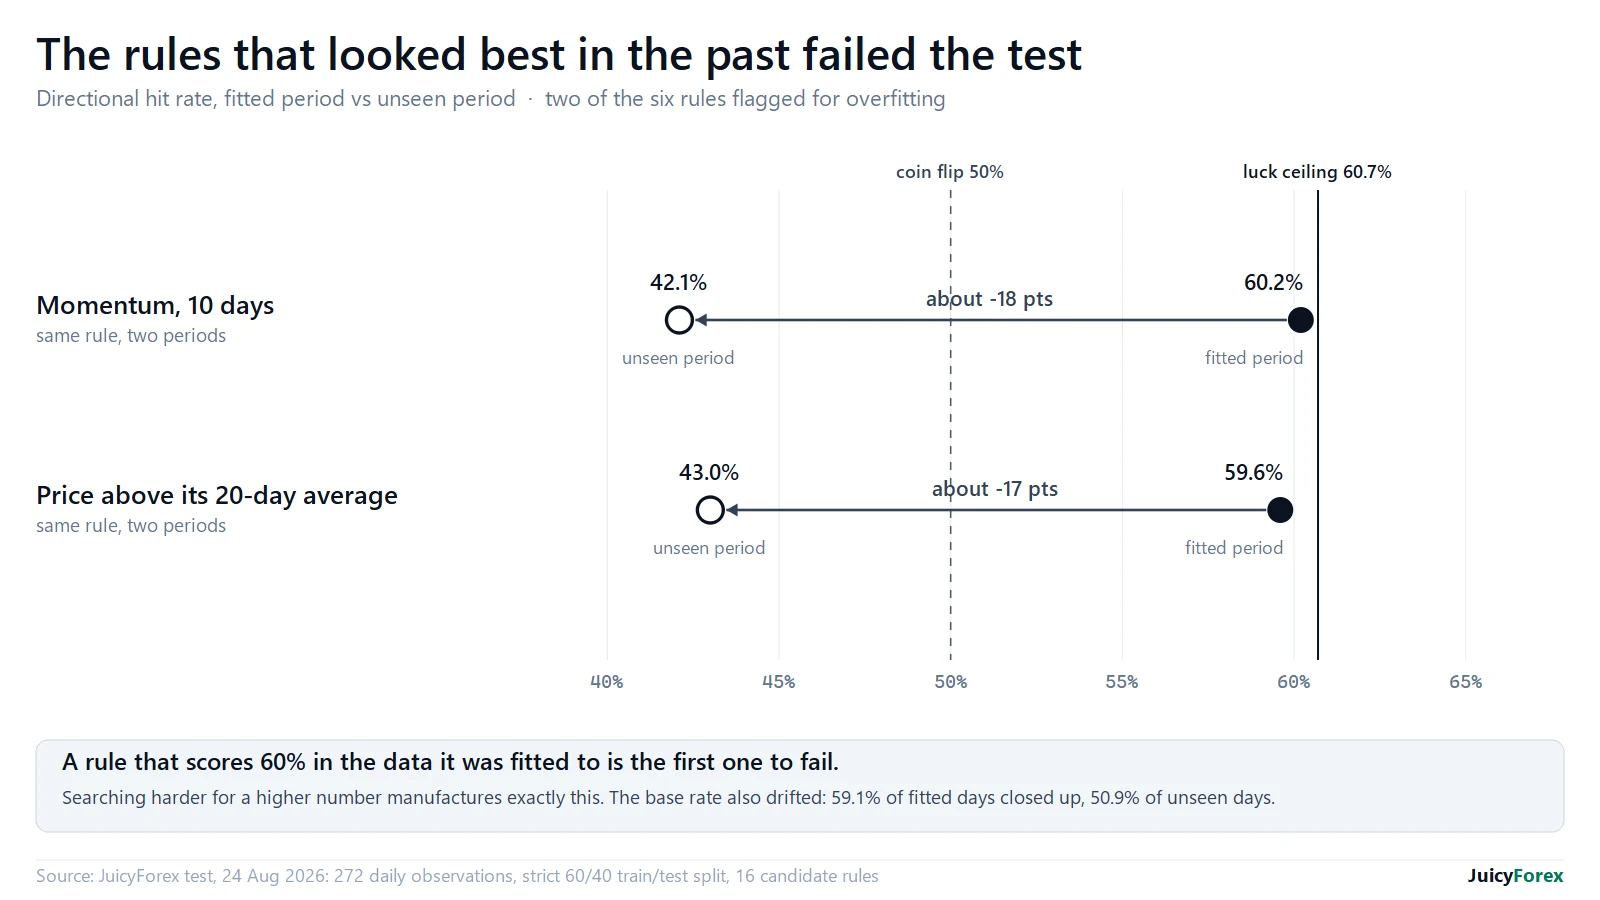
Optimising the period. If your system needs a 47-period EMA to be profitable and fails on 44 and 50, you have not found an edge. You have curve-fitted to noise, and it will disintegrate on live data. Robustness means performing acceptably across a range of parameters, not spectacularly at one.
RSI (Relative Strength Index)
What it measures: the ratio of average gains to average losses over n periods, normalised to a 0–100 scale. Developed by J. Welles Wilder in 1978.
Full guide: The RSI indicator explained properly
The single most expensive misconception in retail trading
"RSI above 70 means overbought, therefore sell."
This idea has cost retail traders more money than any other single concept in technical analysis.
In a strong uptrend, RSI stays above 70 for weeks. That is what a strong uptrend is — a sustained excess of gains over losses. RSI is doing its job perfectly. It is reporting that the trend is powerful.
The trader who shorts because "RSI is overbought" is shorting because the trend is strong. Stated that way, the absurdity is obvious. Dressed in an indicator, it feels like analysis.
Legitimate uses
Momentum regime. In a healthy uptrend, RSI oscillates between roughly 40 and 80 — it does not reach 30. When it starts printing below 40, the character of the trend has changed. This is a genuinely useful, under-taught observation.
Divergence. Price makes a higher high; RSI makes a lower high. Momentum is not confirming. See divergence below, and the warnings attached.
Failure swings. RSI moves above 70, pulls back, and fails to exceed its prior peak on the next price high. More structurally informative than a simple threshold.
Overbought/oversold — but only in confirmed ranges. In a range, mean reversion is the dominant behaviour, and RSI extremes at range boundaries are meaningful. In a trend, they are not. Structure decides which market you are in. RSI cannot tell you.
MACD
What it measures: the difference between a 12-period and 26-period EMA (the MACD line), a 9-period EMA of that difference (the signal line), and the gap between them (the histogram).
Full guide: The MACD indicator explained properly
It is a derivative of a lagging indicator. It is therefore twice removed from price. Treating it as leading is a category error.
Legitimate uses
Histogram as acceleration. When the histogram shrinks while price still advances, the rate of momentum is declining. The trend continues but decelerates. This is genuinely early information — earlier than a crossover, which arrives after the fact.
Zero-line context. MACD above zero means the fast EMA is above the slow — a bullish medium-term structure. Crossings of zero are more meaningful than crossings of the signal line.
Divergence. As with RSI. Same caveats.
How it is misused
Signal-line crossovers as standalone entries. In ranging markets they generate near-continuous whipsaw. Every crossover system requires a trend filter to survive, and once you have added a trend filter, most of the edge is coming from the filter.
Bollinger Bands
What they measure: a moving average with bands at ±2 standard deviations. They are a volatility instrument, not a directional one.
Legitimate uses
Volatility regime. Narrow bands = low volatility = compression. Wide bands = high volatility = expansion. Volatility clusters and mean-reverts, so compression tends to precede expansion.
The squeeze. Historically narrow bands frequently precede a large move. Note carefully: the squeeze does not tell you the direction. It tells you that a move is coming. Traders who infer direction from a squeeze have invented information.
Relative extremes in a range. In a confirmed range, touches of the outer bands mark statistical extremes.
How it is misused
"Price touched the upper band, therefore sell."
In a trend, price rides the band. This is the RSI error in different clothing. A price hugging the upper band for eleven consecutive candles is telling you the trend is exceptionally strong, and the trader who fades it is short a freight train.
A band touch is a statistical statement: price is two standard deviations from its mean. In a normally distributed sample, that is unusual. Financial returns are not normally distributed. They have fat tails. Two-sigma events occur far more often than the model implies. The model is a useful approximation, not a law.
ATR: The Most Underrated Tool
What it measures: the average of the "true range" over n periods (usually 14). True range is the greatest of: current high minus current low; current high minus previous close; current low minus previous close. Also Wilder, 1978.
That third and second definition exist to capture gaps, which a simple high-minus-low would miss.
ATR is the least discussed indicator in retail education and among the most used in professional risk management.
Why it matters
ATR answers the only question that matters at the moment of entry:
How far can this instrument move against me while I am still wrong-but-normal?
A fixed 20-pip stop is arbitrary. It is generous on EUR/USD in a quiet August and reckless on gold before an NFP release. It assumes volatility is constant. It never is, and volatility clustering is one of the most robust findings in financial econometrics.
A stop at 1.5 × ATR(14) beyond your invalidation level is adaptive. It widens automatically when the market is violent and tightens when it is calm. Your stop then sits where the trade is genuinely wrong, rather than where noise happens to reach.
Practical applications
Stop buffer. Place your stop beyond the structural invalidation level, plus 0.5–1.5 × ATR. This is the single highest-value use of any indicator in retail trading, and almost nobody does it.
Zone width. Draw support/resistance zones roughly 0.5 × ATR wide, rather than as lines.
Target realism. If ATR(14) on the daily is 70 pips, a 300-pip intraday target requires an extraordinary session. Not impossible; simply improbable. Knowing this before entry prevents you from setting targets that the instrument does not reach.
Instrument comparison. ATR normalises volatility across instruments. It is how you compare a 40-pip move on EUR/USD with a 400-pip move on gold and recognise they may be equivalent in significance.
Volatility regime. ATR rising = expansion. ATR falling = contraction. Trend systems perform in the former; range systems in the latter.
Volume in Forex — A Warning
Repeat the caution from the beginner guide, because it matters more here:
Full guide: Volume spread analysis and its limits in forex
Forex has no real volume data.
Because FX is decentralised, there is no central record of contracts traded. Your platform's "volume" is tick volume — the number of price changes in a period.
Tick volume correlates reasonably with actual activity, and it is not useless. But it is a proxy, and it varies by broker, because different brokers see different liquidity feeds and therefore different tick counts.
What you can legitimately do with it
Relative comparison within one broker's feed. Was this session's activity higher than yesterday's? That is a fair question.
Confirmation of breakouts. A breakout on unusually high tick volume suggests genuine participation. On low tick volume in the Asian session, it suggests a thin market drifting through a level.
What you cannot do
Compare across brokers. Meaningless.
Apply equity volume analysis. Volume profile, VWAP and volume-spread analysis were developed on centralised exchanges with true volume. Their application to FX tick volume is an approximation, and everyone selling you a course on it should say so, and does not.
Trust "volume" on any FX chart as contracts traded. It is not.
For true volume, use CME futures data — 6E for the euro, 6B for sterling, GC for gold. These trade on a centralised exchange with real reported volume, and they are a legitimate proxy for the underlying spot market's activity.
Divergence
Price makes a new extreme; the oscillator does not.
Regular bearish divergence — price makes a higher high, RSI makes a lower high. Suggests weakening upside momentum. Regular bullish divergence — price makes a lower low, RSI makes a higher low. Hidden bullish divergence — price makes a higher low, RSI makes a lower low. A continuation signal in an uptrend. Hidden bearish divergence — price makes a lower high, RSI makes a higher high. Continuation in a downtrend.
The honest assessment
Divergence is the most over-trusted concept in retail technical analysis.
In a strong trend, divergence appears constantly and means nothing. A parabolic uptrend will print bearish divergence on every single leg, because momentum cannot keep accelerating indefinitely — that is a mathematical property of a bounded oscillator, not a warning about price. Traders shorting each divergence in a trend are shorted out of business by the third one.
Divergence is a statement about the rate of change of price, not about price. Decelerating is not reversing. A car slowing from 90mph to 70mph is still travelling forward at speed.
When divergence is worth something
Require all of the following:
- At a significant level. Divergence in mid-air is worthless. Divergence into a weekly resistance zone is information.
- At the end of an extended move, not the second leg of a fresh trend.
- Confirmed by a break of structure. Divergence tells you momentum is fading. The BOS tells you the fade became a reversal. Never enter on divergence alone — enter on the structural break that follows it.
- On a meaningful timeframe. M5 divergence is noise. Daily divergence is worth reading.
Divergence is a warning to watch, never a signal to enter. Treat it as a reason to look more closely at a level you had already marked.
Confluence: Real and Fake
Confluence means multiple independent analytical reasons pointing to the same conclusion.
The word independent is doing all the work, and it is the word that is always dropped.
Fake confluence
"RSI is oversold, Stochastic is oversold, CCI is oversold, and Williams %R is oversold. Four confirmations!"
One confirmation. All four are momentum oscillators. All four are computed from the same closes. They will nearly always agree, because they are near-identical arithmetic wearing different names.
This is the most common self-deception in retail trading, and it produces overwhelming, entirely unearned confidence.
Real confluence
"Weekly resistance at 1.0950. The 61.8% retracement of the last impulse sits at 1.0948. Round number at 1.0950. Prior week's high at 1.0953. The daily 200 EMA is at 1.0946. And the daily structure just printed a lower high."
Six reasons — a horizontal level, a Fibonacci ratio, a psychological number, a prior extreme, a widely-watched average, and a structural signal. These are genuinely different methods watched by genuinely different participants, and their alignment means the orders of those participants cluster in a narrow band.
That is the mechanism. Confluence works because it identifies where the most orders rest, not because more lines make you more right.
A practical confluence framework
Score a level. Require a minimum before it earns a trade.
| Factor | Points |
|---|---|
| Higher-timeframe structural level (weekly/daily) | 3 |
| Prior swing high/low on trading timeframe | 2 |
| Trend alignment (trading with HTF structure) | 3 |
| Fibonacci 61.8% or 50% of the last impulse | 1 |
| Round number | 1 |
| Widely-watched MA (50/200) confluent | 1 |
| Rejection candle on arrival | 2 |
| Break of internal structure confirming | 2 |
| Session appropriate (London / overlap) | 1 |
| No high-impact news within 1 hour | required, not scored |
Threshold: 7+ points, with trend alignment mandatory.
The numbers are illustrative — you must build your own from your own backtest. The discipline is the point. A score converts a feeling into a rule, and a rule can be tested, and only a tested thing can be trusted.
Multi-Timeframe Analysis
The professional standard: three timeframes
Each roughly 4–6× the one below.
| Role | Example | Question it answers |
|---|---|---|
| Higher | Daily / H4 | Bias. Which direction am I permitted to trade? |
| Intermediate | H1 | Setup. Is my level being approached? Is structure aligning? |
| Lower | M15 / M5 | Trigger. Where exactly do I enter, with the tightest sensible stop? |
Common combinations: D1 / H4 / M15 for swing trading · H4 / H1 / M5 for intraday · W1 / D1 / H4 for position trading.
The rules
Bias is set by the higher timeframe only. If the daily is in an uptrend, you look for longs. Full stop. The H1 downtrend you are staring at is a pullback within it, and it is where you buy, not evidence to sell.
Never let the lower timeframe override the higher. This is the error that ends most intraday careers.
Zoom out when confused. If a chart is unreadable, you are on too low a timeframe. The structure is always clearer one level up. Always.
The inversion error
The single most common mistake in multi-timeframe analysis:
Find a setup on M5 → check the daily for justification.
That is not analysis. It is confirmation bias with extra charts. You have already decided; you are now shopping for evidence, and every chart offers some to a motivated observer.
Top down. Always. Without exception. The daily tells you what you may do. The M5 tells you when. If you open the M5 first, close it.
Timeframe alignment
The highest-probability trades occur when all three agree:
Daily: uptrend (HH, HL) ← permission
H1: pullback into daily support zone ← location
M15: break of the pullback's LH ← trigger
This is the entire framework, and it is enough. Everything else on this page is refinement.
Eight Case Studies
Three of these are losses. Any resource showing you only winners is showing you a marketing document. These are constructed composites illustrating recurring structures — not a track record, and not evidence of profitability.
Case 1 — The Textbook Pullback (Win, +2.4R)
Setup. EUR/USD, daily uptrend intact for six weeks: clear higher highs, higher lows. Price impulses to 1.0980, then retraces.
Confluence at 1.0895–1.0910: prior swing high (structural flip), 50% retracement, daily 20 EMA, round number at 1.0900.
Trigger. Price enters the zone. On M15, the internal downtrend (lower highs) breaks — price closes above the most recent LH.
Execution. Long at 1.0912. Invalidation below the zone at 1.0888. ATR(14) daily = 62 pips; buffer applied. Stop at 1.0876 — 36 pips.
Outcome. Price resumed the uptrend, reaching 1.0998. Exit at the prior high. +86 pips, +2.4R.
What made it work. Not the entry. The permission — higher-timeframe structure said long, and the pullback was where longs are cheap. The M15 trigger merely timed it. Had the daily been ranging, the identical M15 pattern would have been worthless.
Case 2 — The False Breakout (Win, +3.1R)
Setup. GBP/USD ranging for nine days between 1.2680 and 1.2790. Third touch of the range high.
Observation. Everyone can see 1.2790. Buy stops rest above it: short-sellers' protective stops and breakout traders' entries.
The sweep. Price pushes to 1.2804 on an H1 candle — 14 pips beyond the high — then closes back at 1.2782, inside the range.
Trigger. The close back inside. Not the wick; the close.
Execution. Short at 1.2779. Stop above the sweep wick at 1.2812 — a precise invalidation, because if price reclaims that high the sweep thesis is simply wrong. 33 pips.
Outcome. Trapped breakout buyers exited. Price fell to 1.2681, the range low. Exit there. +98 pips, +3.1R.
Why the stop was so tight. The sweep wick is a genuine invalidation point, not an arbitrary distance. Precise invalidation produces tight stops, which produce high reward-to-risk without requiring larger targets. This is where R:R actually comes from — not from setting ambitious targets, but from finding trades where "wrong" is nearby and knowable.
Case 3 — Divergence Alone (Loss, −1R)
Setup. USD/JPY in a powerful uptrend, five consecutive higher highs on H4. RSI prints clear bearish divergence — price higher high, RSI lower high.
The reasoning (flawed). "Momentum is fading. Reversal coming."
Execution. Short at 158.20. Stop above the high at 158.62.
Outcome. Price paused for six candles, then broke to 159.40. Stopped out. −1R.
What went wrong. Everything about the identification was correct. The divergence was real. The reasoning was wrong.
- No level. The short was taken in mid-air, at no significant resistance.
- No structure break. Divergence says momentum is decelerating. It never says direction has changed. The trend never printed a lower low.
- Against higher-timeframe structure. The daily uptrend was unambiguous.
Divergence in a strong trend appears on every leg. It is a mathematical property of a bounded oscillator meeting an unbounded price. Shorting each occurrence is shorting the trend, repeatedly, which is a strategy with a name: losing money.
The lesson. Divergence is a reason to watch a level you had already identified. It is never a reason to enter.
Case 4 — The Overbought Short (Loss, −1R)
Setup. XAUUSD rallying hard. RSI(14) on H1 reaches 82. "Extremely overbought."
Execution. Short. Stop 40 pips above.
Outcome. RSI remained above 70 for thirty-one hours. Gold advanced a further 240 pips. Stopped out within ninety minutes.
What went wrong. RSI above 70 in a strong trend means the trend is strong. That is not a contrarian signal; it is a confirmation of the trend. The trader shorted because momentum was powerful, which, stated plainly, is obviously absurd. Wrapped in an indicator, it felt like analysis.
The lesson. Overbought and oversold are meaningful only in a confirmed range. Structure tells you whether you are in one. RSI cannot, and does not claim to. See the gold guide — this pattern is especially punishing on XAUUSD, which trends violently.
Case 5 — The Retest Entry (Win, +2.0R)
Setup. EUR/USD compressing beneath 1.0850 for four days. Daily structure bullish.
The break. H4 candle closes decisively above 1.0850, at 1.0871. ATR expanding.
The decision — not to chase. Entering at 1.0871 would require a stop below the range, roughly 45 pips away, for a poor reward profile.
The retest. Price returns to 1.0852 two candles later and prints a bullish engulfing candle on M15.
Execution. Long at 1.0858. Stop at 1.0834 — below the retest low, plus buffer. 24 pips.
Outcome. Price advanced to 1.0906. Exit at the next daily resistance. +48 pips, +2.0R.
The trade-off, honestly. Waiting for the retest means missing every breakout that never retests — and roughly half do not. The retest trader takes fewer trades at better prices. Which is superior depends entirely on your backtested numbers, not on which sounds cleverer. Test both. Believe the data.
Case 6 — Correct Analysis, Wrong Event (Loss, −1R)
Setup. AUD/USD, textbook confluence at 0.6580: weekly support, 61.8% retracement, round number, bullish engulfing candle on H4. Scored 9 on the confluence framework.
Execution. Long at 0.6586. Stop at 0.6558.
Outcome. Eleven minutes after entry, US CPI printed materially above expectations. The dollar surged. AUD/USD fell 90 pips in four minutes. Stopped out at 0.6558, with 4 pips of slippage. Actual loss: −1.14R.
What went wrong. The analysis was excellent. The trader did not check the calendar.
A technical level is a statement about where orders rest under current assumptions. When a data release invalidates those assumptions, the orders are pulled. The level did not fail. It ceased to exist, along with the reasoning of every participant defending it.
The lesson. The calendar check is not optional, and it is not part of "fundamental analysis" that technical traders may skip. It is a prerequisite for trusting any technical level. Note also the slippage: stops fill at the next available price, not your price.
Case 7 — The Range Fade (Win, +1.4R)
Setup. EUR/GBP in a clearly defined four-week range, 0.8420–0.8490. Daily 200 EMA flat — no trend regime confirmed.
Reasoning. In a confirmed range, mean reversion dominates. Now — and only now — oscillator extremes are meaningful.
Execution. Price returns to 0.8484 (upper boundary). RSI(14) at 74. Bearish pin bar on H4. Short at 0.8480. Stop at 0.8502, above the range high plus buffer.
Outcome. Price returned to 0.8449, mid-range. Exit. +31 pips, +1.4R.
The point. This is the identical RSI signal that failed catastrophically in Case 4. Same indicator. Same reading. Opposite outcome.
Structure decided. In Case 4, the market was trending, and RSI extremes confirmed trend strength. In Case 7, the market was ranging, and RSI extremes marked boundaries.
The indicator never changed. The context did. If you take one thing from this guide, take this pair of cases.
Case 8 — Timeframe Inversion (Loss, −1R)
Setup. Trader opens M5 on GBP/JPY. Sees a clean double bottom with bullish divergence. Enters long.
Then checks the daily. It is in a decisive downtrend — lower highs, lower lows, a break of structure eight sessions earlier.
Rationalisation. "The daily is oversold. Due a bounce."
Outcome. Price bounced 22 pips, then continued down 140. Stopped out.
What went wrong. The order of operations. The trader found a setup, then sought permission. Because they were already in the trade emotionally, they interpreted an ambiguous daily chart favourably.
The lesson. Top down. Always. Open the daily first. Establish bias. Then open the lower timeframe, and only to time an entry in the direction the daily permits.
If you open the M5 first, you have already decided. The rest is theatre — and you will always, always find a chart that agrees with you.
The Professional Workflow
Analysis is not staring at a chart until an idea appears. It is a sequence, executed identically every session.
Full guide: How to backtest a strategy without fooling yourself
Weekend (60 minutes)
- Mark weekly and daily structure on your chosen instruments. HH, HL, LH, LL.
- Identify three to five significant levels per instrument.
- Note ATR(14) on the daily — this sets your expectation for the week's range.
- Check next week's economic calendar. Mark high-impact events on the chart.
- Write a one-paragraph bias for each instrument. In writing. You will be astonished, later, at what you believed.
Daily pre-session (15 minutes)
- Has weekly/daily structure changed? Update.
- Are any of my levels within reach today, given daily ATR?
- High-impact news today? At what time?
- Current spread — normal?
- Yesterday's journal reviewed.
- Emotional state assessed. Tired, angry, desperate → do not trade.
During the session
- Wait. This is the activity. Not a gap between activities.
- Price approaches a marked level.
- Score the confluence. Below threshold → no trade. No exceptions for "this one looks really good."
- Drop to the trigger timeframe. Await the trigger — a rejection candle, or an internal break of structure.
- Identify invalidation. Place the stop beyond it, plus the ATR buffer.
- Calculate position size from that stop distance. See the risk masterclass.
- Screenshot. Enter. Attach stop and target as a bracket.
- Walk away. Set an alert. Do not watch below your execution timeframe — you will find a reason to interfere, and interference is uniformly costly.
Post-trade (5 minutes)
- Exit screenshot.
- Record in R.
- Score the process: was the plan followed? Yes/No — independent of outcome.
- Emotional state.
Weekly review (45 minutes)
- All trades, sorted by process score.
- Good process, bad outcome → variance. Change nothing.
- Bad process, good outcome → the danger quadrant. This is where destructive habits are formed, because the market rewarded a mistake.
- Win rate by setup, by session, by day of week.
- Is a session or a weekday reliably negative? Remove it. This is the single easiest performance improvement available, and it requires no new skill — only data you already have.
Common Mistakes
1. Indicators before structure. Adding RSI to a chart you cannot yet read. Structure first. For a month.
2. Drawing lines instead of zones. Then being stopped out by 2 pips of noise and blaming the broker.
3. Fading strong trends on "overbought." Cases 4 and 7 exist entirely for this mistake, which is the most expensive misconception in retail trading.
4. Trading divergence alone. It signals deceleration, never reversal. Wait for the structural break.
5. Timeframe inversion. Finding the setup first, then hunting for higher-timeframe justification.
6. Confusing correlated indicators for confluence. Four oscillators agreeing is one opinion, repeated.
7. Chasing the breakout. Buying the candle that closes above resistance, providing the liquidity that fills someone else's sell order.
8. Ignoring the economic calendar. Case 6. A perfect level thirty seconds before CPI is not a level.
9. Ignoring the session. A range strategy at 08:00 UTC. A breakout strategy at 03:00 UTC. Right method, wrong market.
10. Optimising indicator settings. If RSI(9) works and RSI(14) does not, you have found noise and named it an edge.
11. Too many levels. Twenty levels on a chart is zero levels. Three to five.
12. Believing patterns without testing them. If a stranger would not mark the same wedge on the same chart, it cannot be backtested, and an untestable pattern is a story.
13. Analysing after entering. Once you hold a position, every chart supports it. Do all analysis before clicking. Write the thesis down; it is much harder to revise a written sentence than a memory.
14. Mistaking pattern recognition for evidence. Chartists reliably find head and shoulders formations in randomly generated data. Your brain has no false-positive brake. Test everything.
Pro Tips
Mark structure on a bare chart every day for thirty days. No indicators, no trades. This is the highest-value month available in trading education, and almost nobody does it because it produces no excitement.
Zoom out when confused. If the chart is unreadable, you are too low. The structure is always clearer one level up.
Screenshot before entry, never after. Memory reconstructs. It will tell you the setup was obvious when it was not. The image does not negotiate.
Trade one instrument for six months. Every instrument has a personality — how far it overshoots levels, how it behaves at the London open, whether it respects the 20 or the 50 EMA. That knowledge does not transfer, it does not appear in any book, and it compounds.
Use ATR to size your zones and your stop buffers. Not round numbers. Volatility is not constant and your levels should not pretend it is.
Note the time of every trade you take. Then compute expectancy by session after 100 trades. Most traders discover one session where they are reliably negative. Deleting it costs nothing and improves everything.
Write your thesis in one sentence before entry. If you cannot, you are not in a trade. You are in a position, which is different and much worse.
Trade the retest, not the break — until your data says otherwise. Fewer trades, better prices, tighter stops, higher R:R. Then test the alternative properly and follow the numbers rather than the aesthetics.
When a level is spectacularly obvious, ask who is trapped there. The obvious level is where the liquidity is. That is a reason for caution, and sometimes a reason to take the other side.
Expert Insights
On why analysis is the least important skill in trading. A trader with mediocre analysis and precise invalidation levels will outperform a brilliant analyst with no stop, every year, without exception. The market does not pay for correctness. It pays for being sized to survive being wrong. Analysis determines your win rate, which is one of three variables. Risk management determines whether you are present to collect the expectancy. This is why we teach analysis third and not first, and why this page repeatedly defers to the risk masterclass.
On the plateau. Almost every trader who persists hits a wall around months nine to eighteen. Their analysis is genuinely good. Their understanding is real. They are still losing money. The instinct is to learn more analysis. This is the one intervention guaranteed not to help. The gap is not informational, it is behavioural — the knowledge is present, the execution is not yet automatic. It closes through repetition, journaling, and radically reduced position size. Most traders quit here, or respond by buying another course.
On simplicity. Professional charts are conspicuously bare. Not because complexity is unsophisticated, but because every additional condition reduces your sample size, and a small sample cannot distinguish edge from luck. If your setup occurs eleven times a year, you will need a decade to know whether it works. Simplicity is not aesthetic. It is statistical.
On what beginners misunderstand about "the best trades." The best trades feel bad. A pullback into support is, by construction, price moving against you. The last three candles are red. Every instinct says the trend is finished. That discomfort is the entry fee — if the trade felt obvious, everyone would take it, and it would offer no edge. Conversely, the trade that feels most compelling — the breakout you cannot bear to miss, the parabolic move you must join — is the one where you are most likely providing liquidity to someone who planned this weeks ago.
On indicators, finally. Use one, perhaps two, and know precisely what each measures and why it belongs. If you cannot explain what your indicator computes from what inputs — not what it "signals," but what arithmetic it performs — remove it. It is not helping you analyse. It is helping you feel certain, and certainty is the most expensive commodity in this market.
The Analysis Checklist
Weekend preparation
- Weekly and daily structure marked. HH/HL/LH/LL labelled.
- Three to five significant levels marked per instrument, as zones.
- Daily ATR(14) noted. Weekly range expectation set.
- Economic calendar reviewed. High-impact events marked on the chart.
- One-paragraph written bias per instrument.
Before analysing a setup
- Higher timeframe opened first. Bias established before the lower timeframe was opened.
- Trend or range identified via structure, not indicators.
- Level is a zone, sized from ATR, not a line.
- Level has fewer than four prior touches.
- No high-impact news within one hour.
- Session appropriate for this strategy.
Before entry
- Confluence scored. Meets threshold.
- Trend alignment with higher timeframe confirmed.
- Trigger present — rejection candle, or internal break of structure.
- Any indicator reading is consistent with structure, not contradicting it.
- Invalidation level identified precisely. I can say, in one sentence, what would prove me wrong.
- Stop placed beyond invalidation, plus ATR buffer.
- Position size calculated from the stop distance.
- Target is a level, not a wish.
- Thesis written in one sentence.
- Screenshot taken.
After
- Exit screenshot.
- Result in R.
- Process scored, independent of outcome.
Cheat Sheet
Structure Uptrend = HH + HL · Downtrend = LH + LL · Range = neither BOS = uptrend prints a lower low, or downtrend prints a higher high
The order of analysis
Structure → Level → Context → Trigger → Invalidation → Size
Levels Draw zones ≈ 0.5 × ATR wide · Fewer than four touches · Weekly > daily > H4 > H1 They fail when the fundamental reason for them disappears
False breakout Push through → close back inside → move opposite The close is the signal, never the wick
Candlesticks Sentence. Location is the paragraph. Structure is the book.
Indicators All are transformations of price. None add information. RSI > 70 in a trend = trend is strong, not "sell" Price rides the Bollinger band in a trend Divergence = deceleration, not reversal. Wait for the BOS.
ATR Stop buffer = 0.5–1.5 × ATR(14) beyond invalidation Zone width ≈ 0.5 × ATR Realistic target ≤ daily ATR for an intraday trade
Confluence Independent methods only. Four oscillators = one opinion.
Multi-timeframe HTF = bias (permission) · Mid = setup (location) · LTF = trigger (timing) Top down. Always.
The two rules that survive everything 1. Never take a signal that contradicts higher-timeframe structure. 2. Check the calendar before trusting any level.
Glossary
ATR (Average True Range) — A volatility measure using the greatest of (high − low), (high − prior close), (low − prior close). Its primary use is adaptive stop placement.
Full guide: The full forex and gold trading glossary
Break of structure (BOS) — Price violating the swing point that defined the prevailing trend. An uptrend making a lower low.
Confluence — Multiple independent analytical methods identifying the same level. Correlated indicators agreeing is not confluence.
Divergence — Price makes a new extreme; the oscillator does not. Indicates decelerating momentum. Never a standalone entry.
EMA — Exponential moving average. Weights recent prices more heavily than an SMA.
External structure — Higher-timeframe structure. Contrast with internal structure, the lower-timeframe structure within it.
False breakout — Price closes beyond a level, then closes back inside. Frequently caused by a liquidity sweep.
Higher high (HH) / Higher low (HL) — The defining sequence of an uptrend.
Impulse — A move in the direction of the prevailing trend. Contrast with correction.
Liquidity sweep — Price pushing beyond an obvious level to trigger resting stop orders, providing counterparties for a large order, then reversing.
Lower high (LH) / Lower low (LL) — The defining sequence of a downtrend.
Marubozu — A candle with no wicks. One side controlled the entire period.
Order block — A candle or zone from which a significant institutional move originated. Terminology varies; treat it as a supply/demand zone with a specific origin.
Pin bar — A candle with a long wick and small body. A record of rejection.
Pullback — A correction against the prevailing trend, terminating at a confluence zone.
Retest — Price returning to a broken level, which now acts in the opposite role.
RSI — Relative Strength Index. The ratio of average gains to average losses over n periods, scaled 0–100.
Squeeze — A period of unusually narrow Bollinger Bands. Indicates compression. Does not indicate direction.
Support / Resistance — Price zones where buying or selling has previously overwhelmed the opposite side, and where orders may still rest.
Swing high / low — A candle whose high (or low) exceeds those of the n candles either side.
Tick volume — The number of price changes in a period. The only "volume" available in decentralised FX. Not contracts traded.
Volatility clustering — The empirical tendency of high-volatility periods to follow high-volatility periods. The statistical basis for ATR-adaptive stops.
People Also Ask
Is technical analysis or fundamental analysis better for forex?
They answer different questions. Fundamentals set the direction capital is flowing over weeks and months, driven by interest rate expectations. Technicals tell you where orders rest, where to enter, and where your idea is proven wrong. Professionals use fundamentals as a bias filter and technicals as an execution layer. Neither works alone.
How many indicators is too many?
More than two, usually. Every indicator is a mathematical transformation of price and contains no information price does not. Four momentum oscillators agreeing is one opinion repeated four times, not four confirmations. There is a strong inverse relationship between the number of indicators on a retail chart and the size of the account.
What timeframe is best for forex trading?
Three of them, each roughly four to six times the one below. The higher timeframe sets your directional bias, the intermediate identifies the setup, the lower times the entry. Daily/H4/M15 suits swing trading. If you can only trade two hours a day, use the London/New York overlap, 12:00–16:00 UTC.
Why do my stop losses always get hit before price reverses?
Because you are placing them where everyone else places theirs, typically one tick beyond an obvious swing low. That cluster of resting stop orders is a pool of liquidity, and whoever needs to fill a large order will reach for it. Use a volatility-based buffer of 0.3–0.5 × ATR(14) instead.
Does technical analysis work on gold?
The framework transfers; the parameters do not. Gold's daily range is routinely two to three times EUR/USD's in percentage terms, it overshoots levels by several dollars before reversing, and it sweeps liquidity more aggressively than any major pair. The same stop discipline that works on majors is fatally tight on XAUUSD.
Frequently Asked Questions
Does technical analysis actually work in forex? It works as a framework for probabilistic decision-making, not as a forecasting tool. Its genuine value is that it produces repeatable, testable rules for identifying favourable situations and, crucially, for defining precisely where you are wrong. Levels have real causal power because enough participants watch them and because orders genuinely cluster around them. But no pattern predicts price, backtested edges decay as they become known, and any fundamental catalyst overrides every technical level instantly.
What is the most accurate technical indicator? None, and the question misunderstands what indicators do. Every indicator is a transformation of price and contains no information price does not. If forced to name the most useful, it is ATR — because it is the only common indicator that directly improves risk management rather than entry timing, and risk management is what actually determines outcomes.
How many indicators should I use? One or two, at most, and only if you can explain precisely what arithmetic each performs. Adding indicators does not add information; it adds correlated views of the same data and an unearned feeling of certainty. There is a strong inverse relationship between the number of indicators on a retail trader's chart and the size of their account.
How do you identify a trend in forex? Structure, not indicators. An uptrend makes higher highs and higher lows; a downtrend makes lower highs and lower lows. Anything else is a range. A moving average tells you the same thing, twenty candles late.
What is market structure in trading? The sequence of swing highs and swing lows that defines whether a market is trending or ranging. It is the foundation beneath every other technical concept — support and resistance, patterns, indicators all derive their meaning from it. A break of structure occurs when price violates the swing point that defined the trend.
Why does support and resistance fail? Because the reason participants respected the level disappeared — almost always a fundamental catalyst. The limit orders defending a level were placed under assumptions. When a CPI print or a central bank statement invalidates those assumptions, the orders are pulled. The level did not weaken; it ceased to exist. This is why the economic calendar is a prerequisite for trusting any technical level.
How do I avoid false breakouts? Four methods, used together or separately: wait for a candle close beyond the level rather than a wick; trade the retest instead of the break; trade the failure — enter against trapped breakout traders once price closes back inside; and require a catalyst, since breakouts during the London session or on news carry real order flow while breakouts at 03:00 UTC generally do not.
Which timeframes should I use? Three, each roughly 4–6× the one below. The higher timeframe sets bias, the intermediate identifies the setup, the lower times the entry. Common combinations: D1/H4/M15 for swing trading, H4/H1/M5 for intraday. Always analyse top down. If you open the lowest timeframe first, you have already decided, and everything after is confirmation bias.
Does RSI overbought mean I should sell? No, and this misconception has cost retail traders more than any other idea in technical analysis. In a strong uptrend RSI stays above 70 for weeks — that is what a strong uptrend is. Overbought and oversold readings are meaningful only inside a confirmed range. Structure tells you whether you are in one; RSI cannot.
Do candlestick patterns work? In isolation, studies find performance close to random. Filtered by structural location and trend context, they become useful. A pin bar at a fresh weekly high after an extended rally means something entirely different from the identical pin bar mid-range on a quiet Tuesday. The candle is a trigger, never a reason.
Is volume useful in forex? Only with severe caveats. Forex is decentralised, so no true volume data exists. Your platform shows tick volume — the number of price changes — which varies by broker and is not contracts traded. It is fair for relative comparison within one feed. It is not valid for cross-broker comparison, and equity volume techniques do not transfer cleanly. For true volume, use CME futures data.
What is confluence in trading? Multiple independent analytical reasons pointing to the same level. The word "independent" is essential and always omitted. Four momentum oscillators agreeing is one opinion repeated four times. A weekly level, a Fibonacci retracement, a round number, and a widely-watched moving average aligning is genuine confluence — because different groups of participants are watching different things and their orders cluster in the same narrow band.
Should I learn price action or indicators first? Price action and structure, without question, and for at least a month with a completely bare chart. Indicators derive their meaning from context, and structure is the context. A trader who learns indicators first spends years interpreting readings without knowing what market they are in.
How long does it take to learn technical analysis? Reading a chart competently takes six to twelve months of daily practice. Understanding the concepts takes weeks. The gap between those two numbers is repetition, and it cannot be shortened by consuming more content.
Resources
Continue here
- Forex Trading Strategy & Risk Management Masterclass — where this analysis becomes a system: expectancy, position sizing, journaling, backtesting, psychology. Read this next. It matters more than this page did.
- XAUUSD (Gold) Master Guide — technical analysis applied to a specific, difficult instrument.
- The Complete Beginner Forex Trading Guide — if any mechanics here were unfamiliar, go back.
- Forex Trading Education — Homepage — the full learning path.
Free tools
Position Size Calculator · ATR Stop Calculator · Trading Journal Template · Bar Replay Trainer · Context Quiz
Primary sources
- J. Welles Wilder, New Concepts in Technical Trading Systems (1978) — the original source for RSI, ATR and ADX. Read the source, not the fifteenth paraphrase.
- CME Group — education on volatility measurement, and real volume data for currency futures.
- Bank for International Settlements — market structure and turnover.
- Federal Reserve FOMC calendar — for the calendar check that Case 6 exists to teach.
Books
- Trading Price Action Trends — Al Brooks. Dense to the point of hostility. Rewarding.
- Technical Analysis of the Financial Markets — John Murphy. The standard reference. Read critically.
- Evidence-Based Technical Analysis — David Aronson. The most important book on this list. It will make you sceptical of most of the others, which is the point.
- Fooled by Randomness — Nassim Taleb. On pattern recognition in noise.
Conclusion & Next Steps
Most technical analysis education is a catalogue. Thirty patterns, twelve indicators, a hundred rules, no framework connecting any of it.
This guide has argued for something simpler and much harder.
Structure is the skeleton. Higher highs and higher lows, or lower highs and lower lows, or neither. It has no settings, no lag, and it works on every instrument that has ever been charted.
Levels are where the orders rest. They matter because participants transact there and leave orders behind, and they fail when the assumptions behind those orders are invalidated — which is why you check the calendar.
Candles record what happened. They do not signal what will happen. The same pin bar is a gift at a weekly high and a trap in mid-range.
Indicators measure. They do not know. Every one of them is arithmetic performed on price you can already see. RSI above 70 in a trend means the trend is strong. Price riding the upper Bollinger band means the trend is strong. Divergence in a trend means the trend is decelerating, which is not the same as stopping.
Confluence requires independence. Four oscillators agreeing is one opinion in four costumes.
Analyse from the top down. The daily grants permission. The M5 provides timing. Reverse that order and you are not analysing — you are shopping for agreement, and you will always find it.
And beneath all of it, the sentence this page keeps returning to:
The invalidation level is worth more than the entry.
A trader with a mediocre entry and a precise stop will outlast a brilliant analyst with no stop. Every year. Without exception. The market does not pay for being right. It pays for being sized to survive being wrong, and for still being here when the setup with the edge finally arrives.
What to do this month
Weeks 1–4. Bare chart. One instrument — EUR/USD. Mark every swing high and swing low. Label HH, HL, LH, LL. Draw a vertical line at every break of structure. Every day. No indicators. No trades.
Then. Add levels. Three to five per timeframe, drawn as zones sized from ATR. Note which hold, which break, and what was on the economic calendar when they broke.
Then. Add one indicator, and only if you can say precisely what arithmetic it performs on which inputs. ATR is the correct first choice, and possibly the last.
Then. Read the Strategy & Risk Management Masterclass, and learn to turn all of this into a system with a measurable edge — and to size it so that being wrong costs you 1% and being right pays for a hundred such errors.
You will not need thirty patterns. You will need a skeleton, a calendar, and the patience to wait for price to come to you.
Start Here
→ Continue to the Strategy & Risk Management Masterclass Expectancy, position sizing, journaling, backtesting, drawdown and psychology. The pillar that actually decides your outcome.
→ Download the Technical Analysis Cheat Sheet (PDF) Two pages. Structure, levels, false breakouts, indicator warnings, annotated charts. Free, no email.
→ Try the Bar Replay Trainer Historical charts, advanced one bar at a time. Mark structure. Place trades. Scored on process adherence, not P&L.