

Of 26 zones on 14 maps, 5 were reached and went on through their far level (one of those was later voided by a close beyond its line), and 21 were never reached, ten of them by under five points. The sample is far too small to say anything about skill, the archive has a 26-hour gap, and the maps lived 40 minutes to four hours against a touch chance measured over a full session. Read it as a record of how maps behave, not as a track record.
How each map is scored
Every map is scored from the moment it was published until the first of: the next map replacing it, the map’s own stated expiry, or four hours. For each zone we record three things:
- Reached. Price traded at the zone’s near edge.
- Traversed. Price then traded through to the far-edge level.
- Voided. A 15-minute candle closed beyond the invalidation line.
The system had already scored the 14 zones from 16–17 October itself. We re-scored them with an independent script and all 14 agree (reached, traversed, voided and minutes to first touch). For 13–15 October, the project’s own hand-written notes scored 8 of the 12 zones and agree with our script on reached, traversed and voided; they measured distances from the anchor bar rather than from publication, so a few closest-approach figures differ. The other 4 rest on our script alone. Left out are two short test runs on 16 October (shadow runs that drew nothing), a duplicate of the 15:00 map, and the 03:00 map on 17 October, for which the saved tape holds no later prices. One rule matters for the 15 October map: it stated that it had to be rebuilt before the 20:30 US data, so it is scored only up to 20:30. Prices are OANDA XAUUSD 15-minute candles, each labelled by the time it opens; times are Singapore time (UTC+8).
The record in one chart
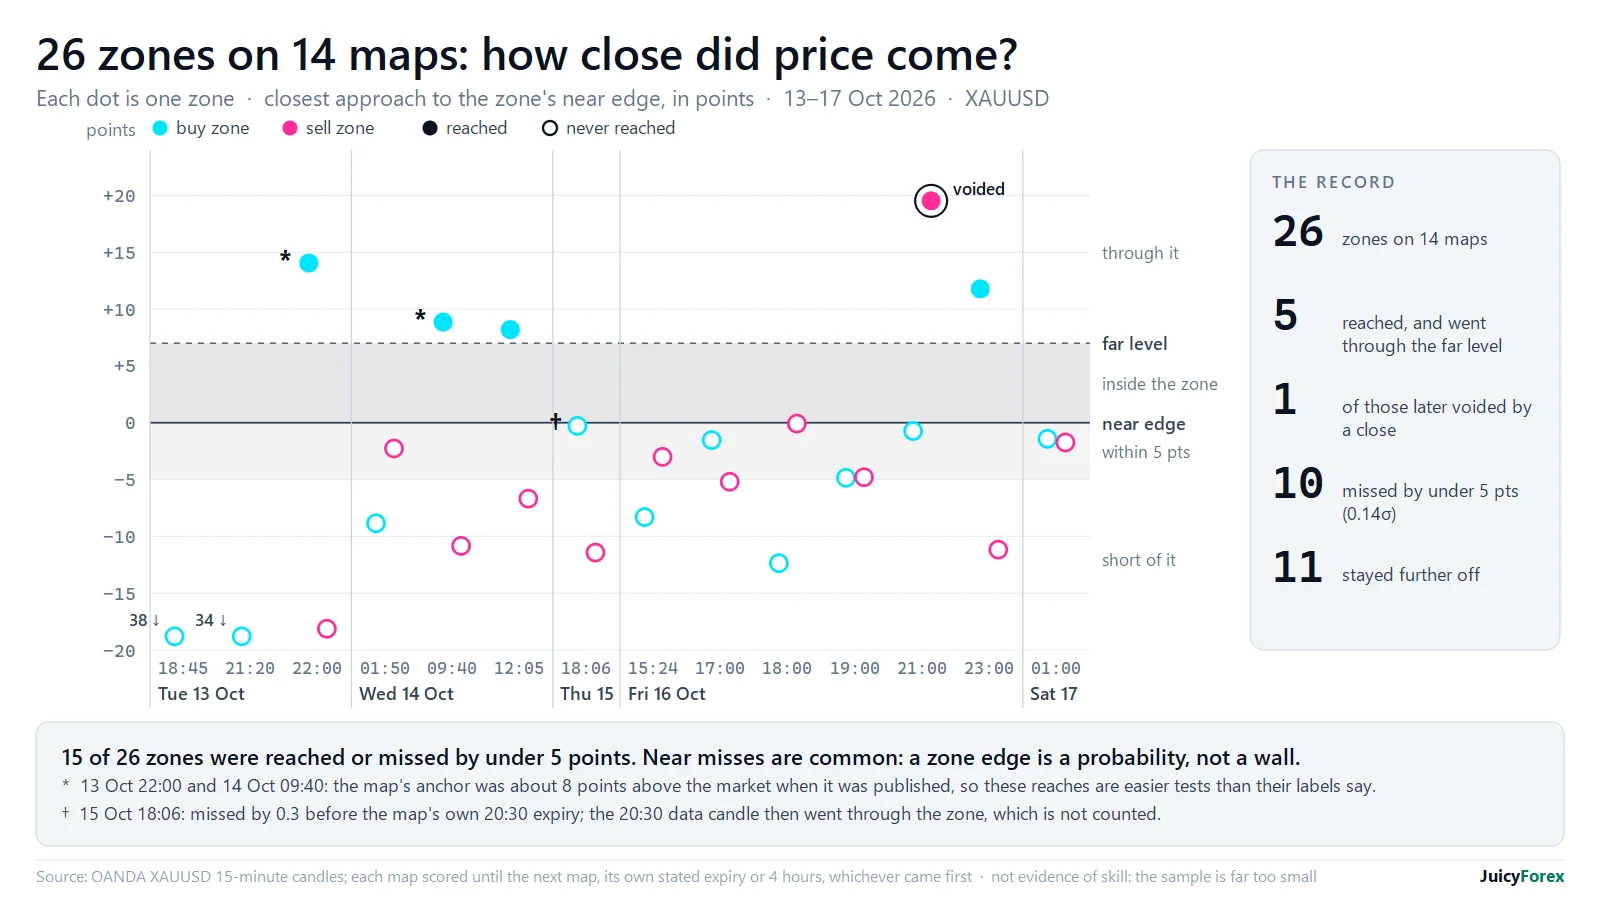
The chart plots how far price came toward each zone’s near edge. Zero is the near edge; the shaded band above it is the zone itself, and the dashed line its far-edge level. Below zero is the distance still to go. Ten zones missed by under five points, about 0.14σ.
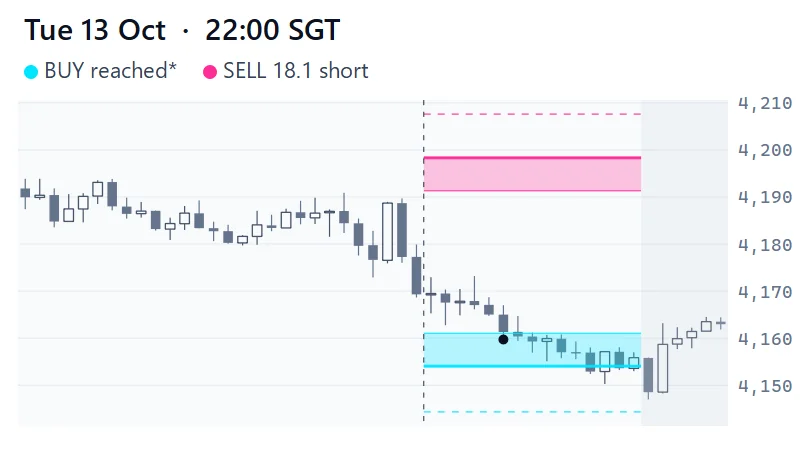
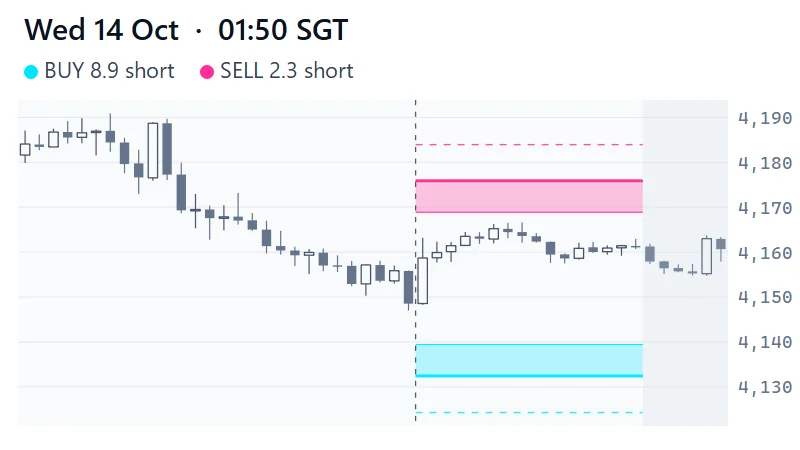
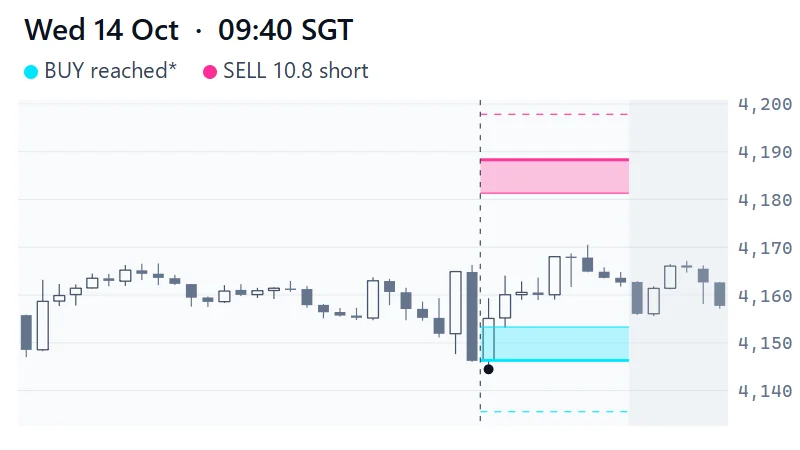
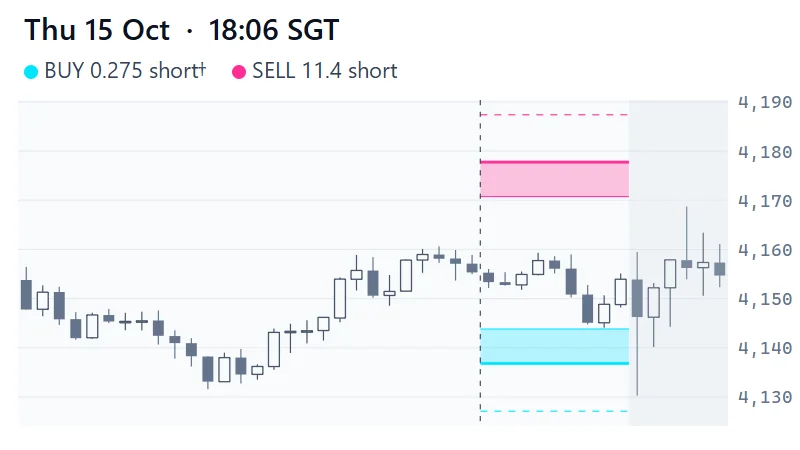
Three notes. (*) Two of the five reached zones, the buys on the 13 October 22:00 map and the 14 October 09:40 map, come from maps whose anchor close was about 8 points above the market when they were published. The 09:40 map’s own note says 7.3; the 22:00 map’s anchor is 15 minutes older than its time stamp, and price fell 8 points in that time. Their labelled distances were too long, so reaching them was an easier test than their touch chances suggest. The project’s own notes call the 09:40 reach not a clean fill after publication and did not score it as one; we count it, with the asterisk. The 14 October 01:50 map had the same 7.4-point gap, but its zones were not reached. (†) The 15 October map stated that it had to be rebuilt before the 20:30 US data. Its buy zone missed by 0.275 points before then, and the 20:30 data candle went through the whole zone; that is after the map’s expiry, so it is not counted as a hit. All three are in the numbers above as they stand.
Three things the archive shows
Near misses are common
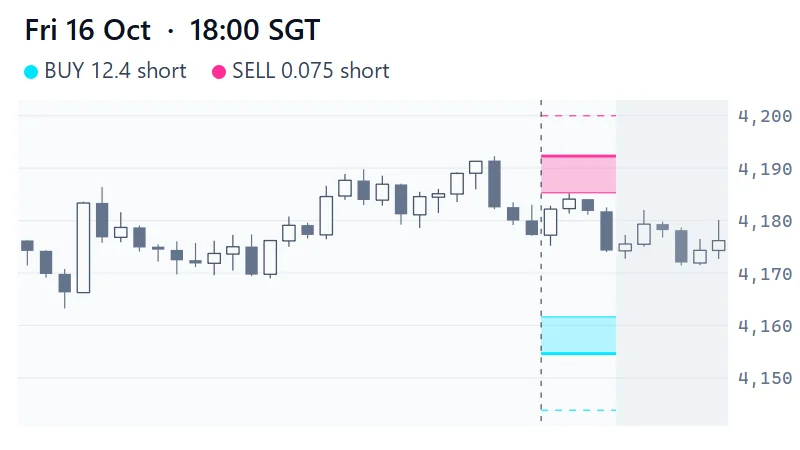
The 18:00 sell zone on 16 October missed its near edge by 0.075 points: seven and a half cents. A zone edge is a probability, not a wall, and a method that demands an exact touch will miss a lot of good moves. It is also why we state distances in σ, not in pennies.
A zone too far away never gets a chance
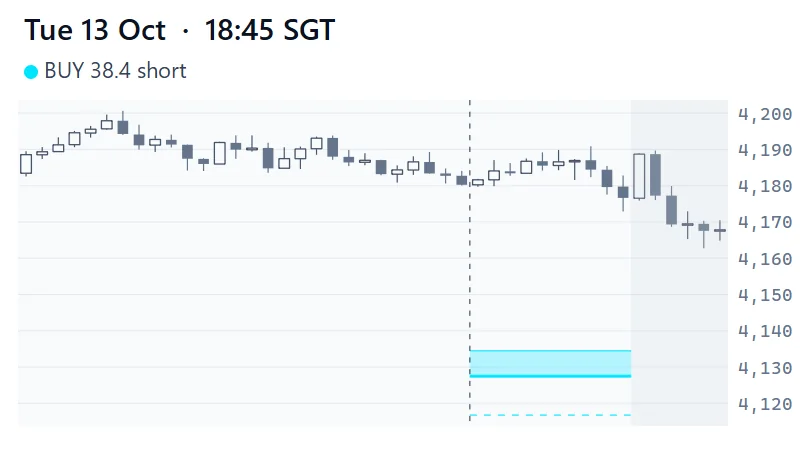
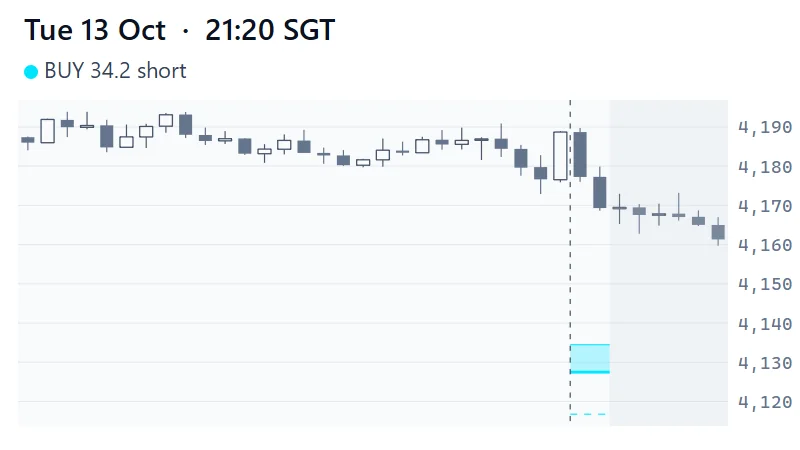
The first two maps, on 13 October, held one buy zone, re-stamped, drawn too far from price: touch chances of 15.8% and 20.1%, and price never came within 34 points. The cause was a change made after an earlier map failed: the screen that sets the distance had been switched from volatility sizing (σ) to a multiple of a session’s 90th-percentile bar range, and it was never switched back, so zones sat further from price than before; the last two were the two least reachable buy zones of the 24 published up to then. We caught it on 13 October by measuring every published map, and reverted it that evening. The next map, published at 22:00, went back to about 50%, and its buy zone was reached 75 minutes later, although that map’s anchor also sat about 8 points above the market.
Reached is not the same as held
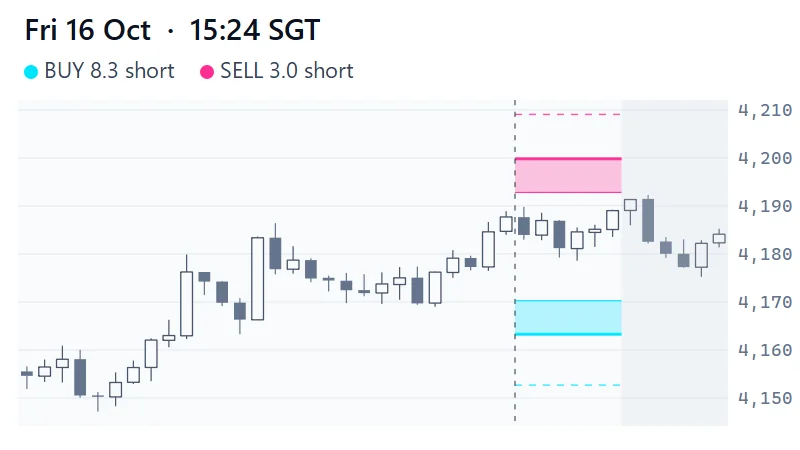
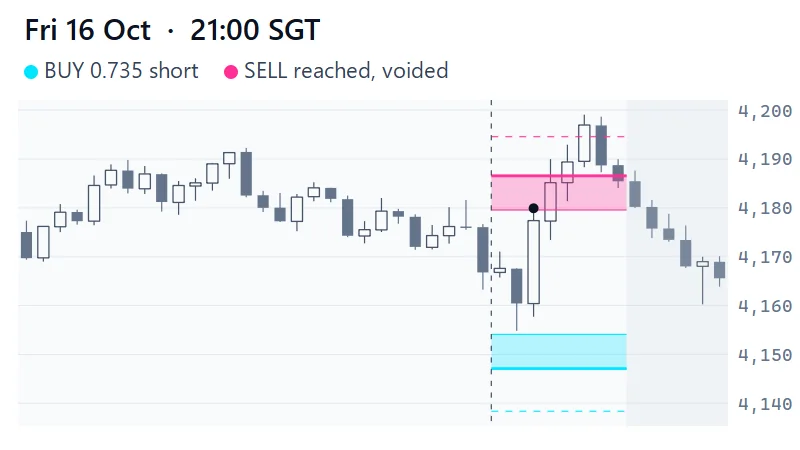
The 21:00 sell zone on 16 October was reached 30 minutes after publication and traversed 15 minutes later, then voided when the 22:15 candle closed above its line, and price fell 15 points from its peak. The invalidation line existed to say so in advance. See the chart.
All 14 maps
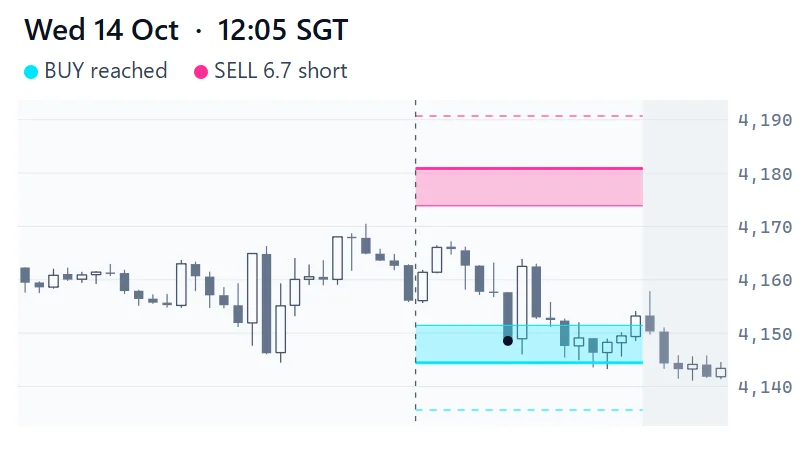
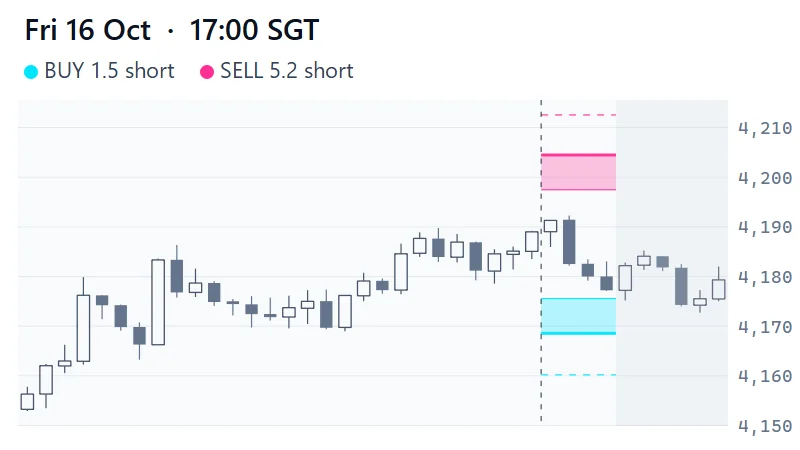
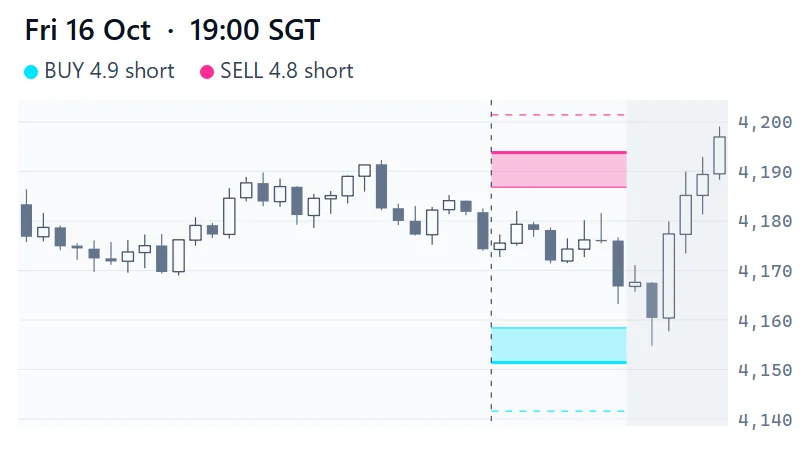
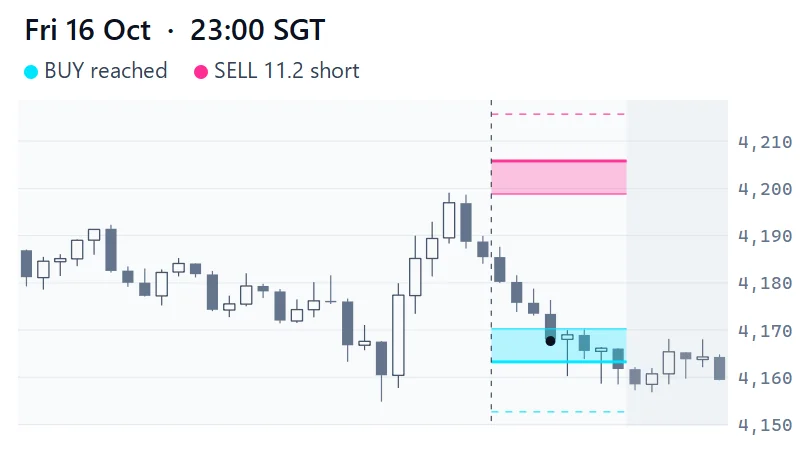
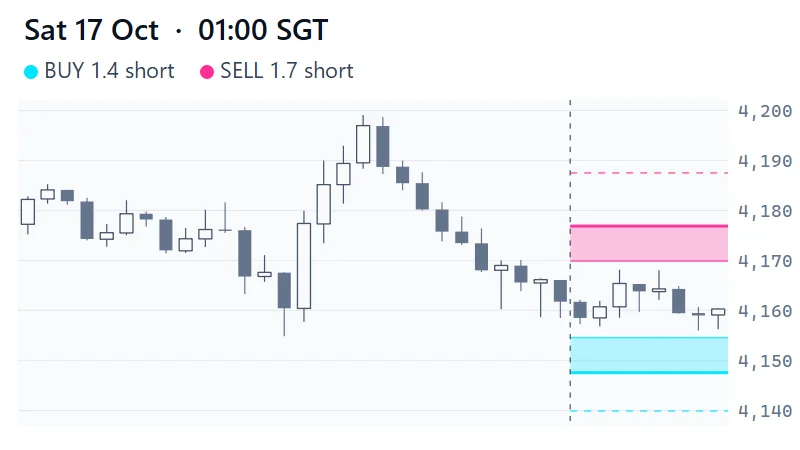
Each chart shows 28 bars before publication, the map’s life, and a few bars after. Scoring stops when the next map replaced a map, at its own stated expiry or at four hours (the pale wash). A black dot marks the candle that first reached a zone. * and † mark the two results explained above.
What this cannot tell you
- Skill. Fourteen maps and 31.5 hours of scoring in all is far too few. With this few observations luck can produce almost any result: see how lucky a useless rule can look.
- Calibration. The touch chance on each label is a one-session probability, measured on 10,856 historical levels. These maps lived 40 minutes to 4 hours, so a low reach rate here is expected and says nothing about that table.
- Completeness. Not every map is here. No file survives for the maps published on the evening of 14 October and the morning of 15 October, a gap of about 26 hours that includes the CPI release, so those hours are unscored. And the 26 zones include one exact repeat: the 21:20 map on 13 October re-published the 18:45 map’s buy zone.
- Profit. Nothing here models entries, stops, position size, costs or fills. It scores levels, not trades.
- Other regimes. Gold spent these days between roughly 4,070 and 4,200. A trending week would score differently.
Method and data
Frequently Asked Questions
Did these maps make money?
We do not know and this archive cannot say: it scores levels, not trades. No entries, stops, position sizes, costs or fills are modelled.
Why only 14 maps?
The archive starts on 13 October 2026, the first day whose maps are backed up together with the price data they were built on. It is not continuous: no file survives for the maps published on the evening of 14 October and the morning of 15 October, a gap of about 26 hours that includes the CPI release, so those hours are not scored. The first two maps in it used a distance rule that was reverted the same evening.
What do near edge and far edge mean?
The near edge is the side of the band price meets first; the far edge is the opposite side and carries the level. A zone is reached when price touches the near edge and traversed when it goes on to the far edge.
Why were two maps drawn so far from price?
On 13 October the screen was using a multiple of a session's 90th-percentile bar range instead of volatility sizing, a change made after an earlier map failed and never reverted. The two maps, which held the same buy zone, priced at 16% and 20% for a full session and price never came within 34 points. The rule was reverted that evening and the next map priced at about 50%.
70–80% of retail investor accounts lose money trading CFDs. This page is education, not advice. All trade examples are constructed composites.