

Luck can produce a 60% hit rate; none of twelve popular price-pattern methods cleared that bar and four pointed the wrong way; gold’s big days are far more common than the bell-curve formula says; news is an hour, not a day; about a third of gold’s variance lands in the Singapore evening; spreads are small except for about five minutes; and oil’s sign was backwards. Each finding below has its chart, its sample size and its caveat.
1. Luck can look like skill
We tested 16 simple directional rules on about 107 days of gold, then ran the same 16 rules on shuffled returns, where no signal can exist. The best rule on pure noise scored 57.0% at the median, 60.7% at the 90th percentile and 66.4% at the maximum. The best real rule scored 59.8%: inside that range.
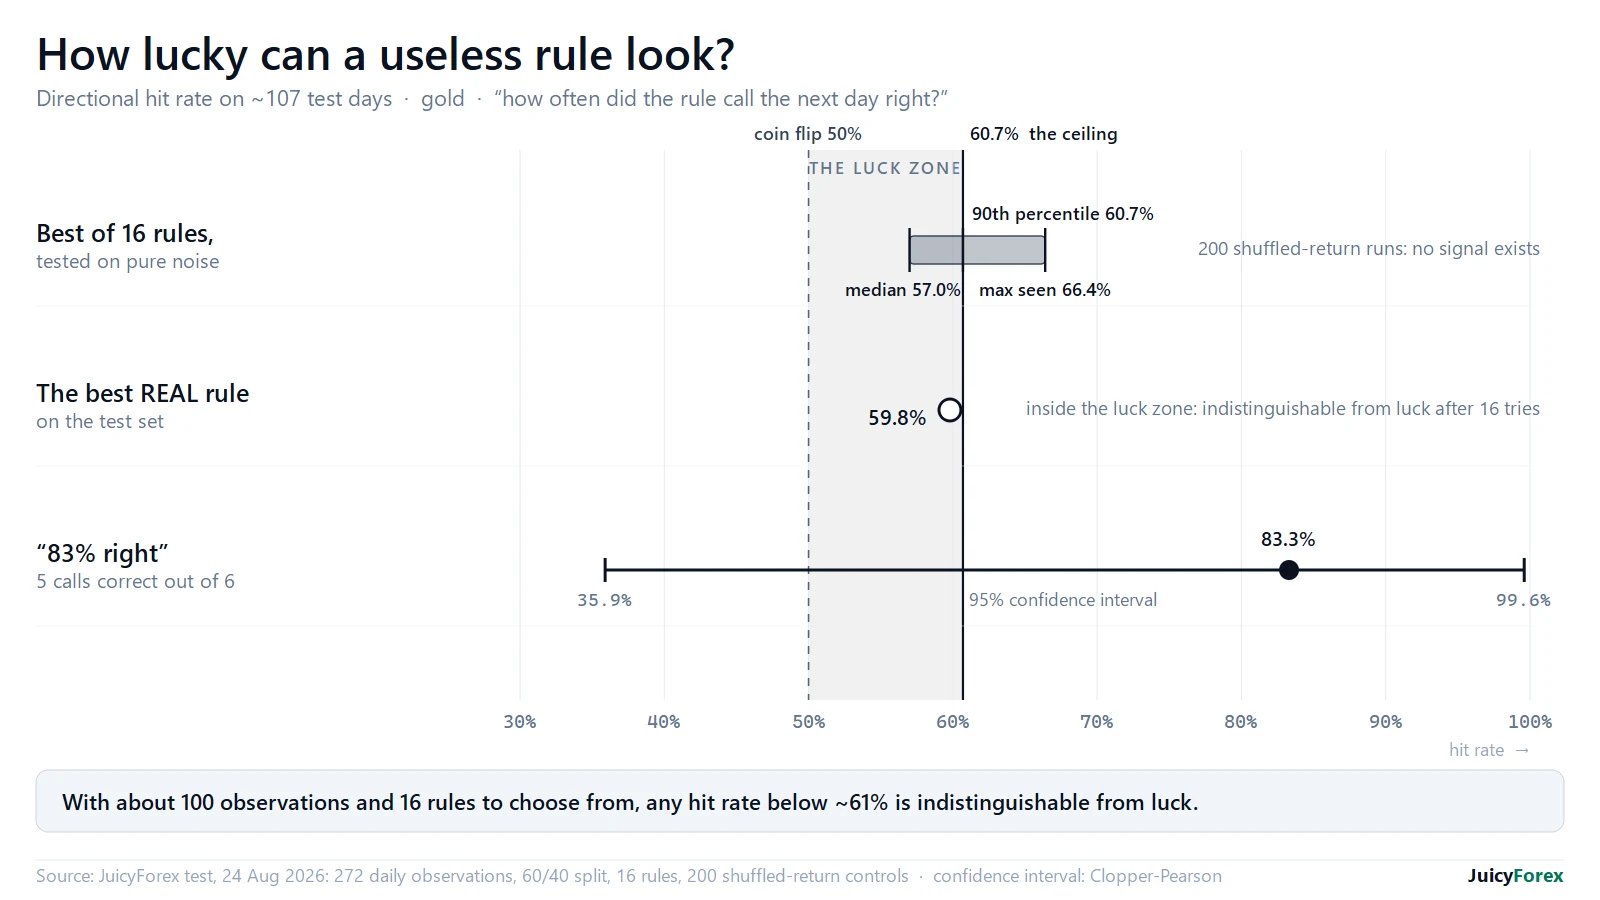
The practical rule: with around 100 observations and a handful of rules to choose from, a hit rate below about 61% is indistinguishable from luck. The same arithmetic hits a short track record: 5 correct calls out of 6 is 83%, but its 95% confidence interval runs from 36% to 99.6%. Before you trust a number, ask how many things were tried and how many observations there are. See do you have an edge?
2. The best-looking rules fail first
Six of the 16 rules were flagged for overfitting. A 10-day momentum rule scored 60.2% on the period it was fitted to and 42.1% on unseen days; “price above its 20-day average” went from 59.6% to 43.0%. Searching harder for a higher number manufactures exactly this: the rules that look best in the past are the ones most fitted to its noise.
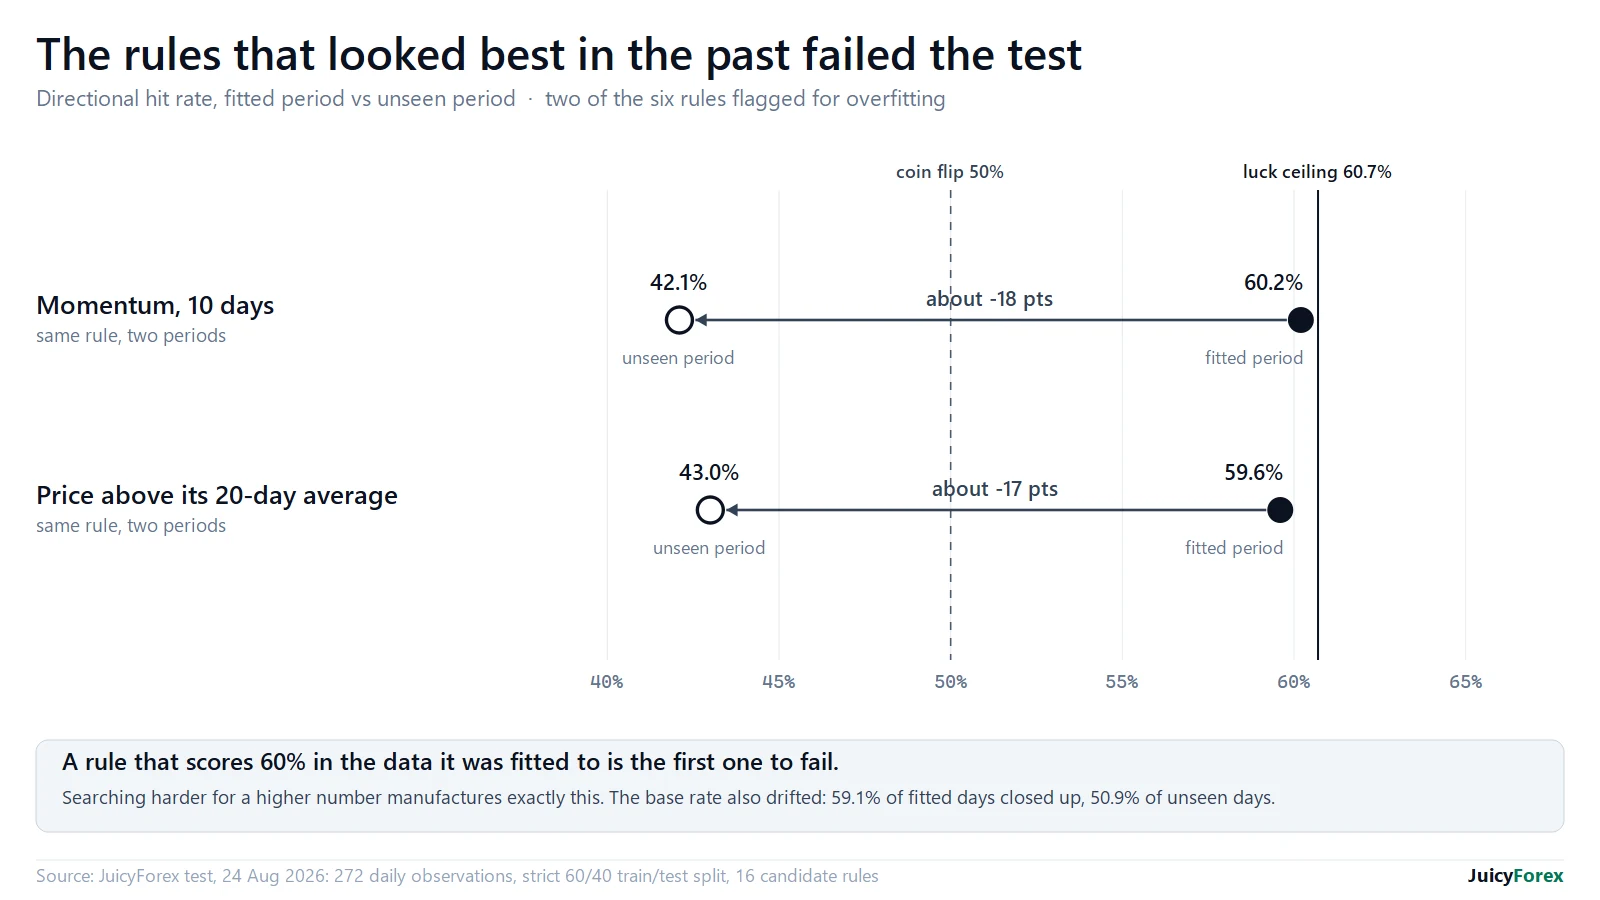
The base rate moved too: 59.1% of the fitted days closed up, against 50.9% of the unseen days. A rule fitted in one regime inherits that drift as fake edge. See avoiding overfitting.
3. Twelve classic methods, none clears the bar
We then scanned twelve popular concepts (thirteen counting rally-base-rally and drop-base-drop separately) on 17 years of 15-minute gold, with definitions frozen before any run and every result compared with a matched control. The question was simple: after the signal, did price go the way the method says over the next hour? Nothing reached 60.7%, the luck ceiling from finding 1. That bar is deliberately high: with thousands of signals, a gap of a few points from 50% is statistically real, so the question is whether it is big enough to use. The best, second touch of a level, scored 53.3%, and every effect decayed to zero by 24 hours.
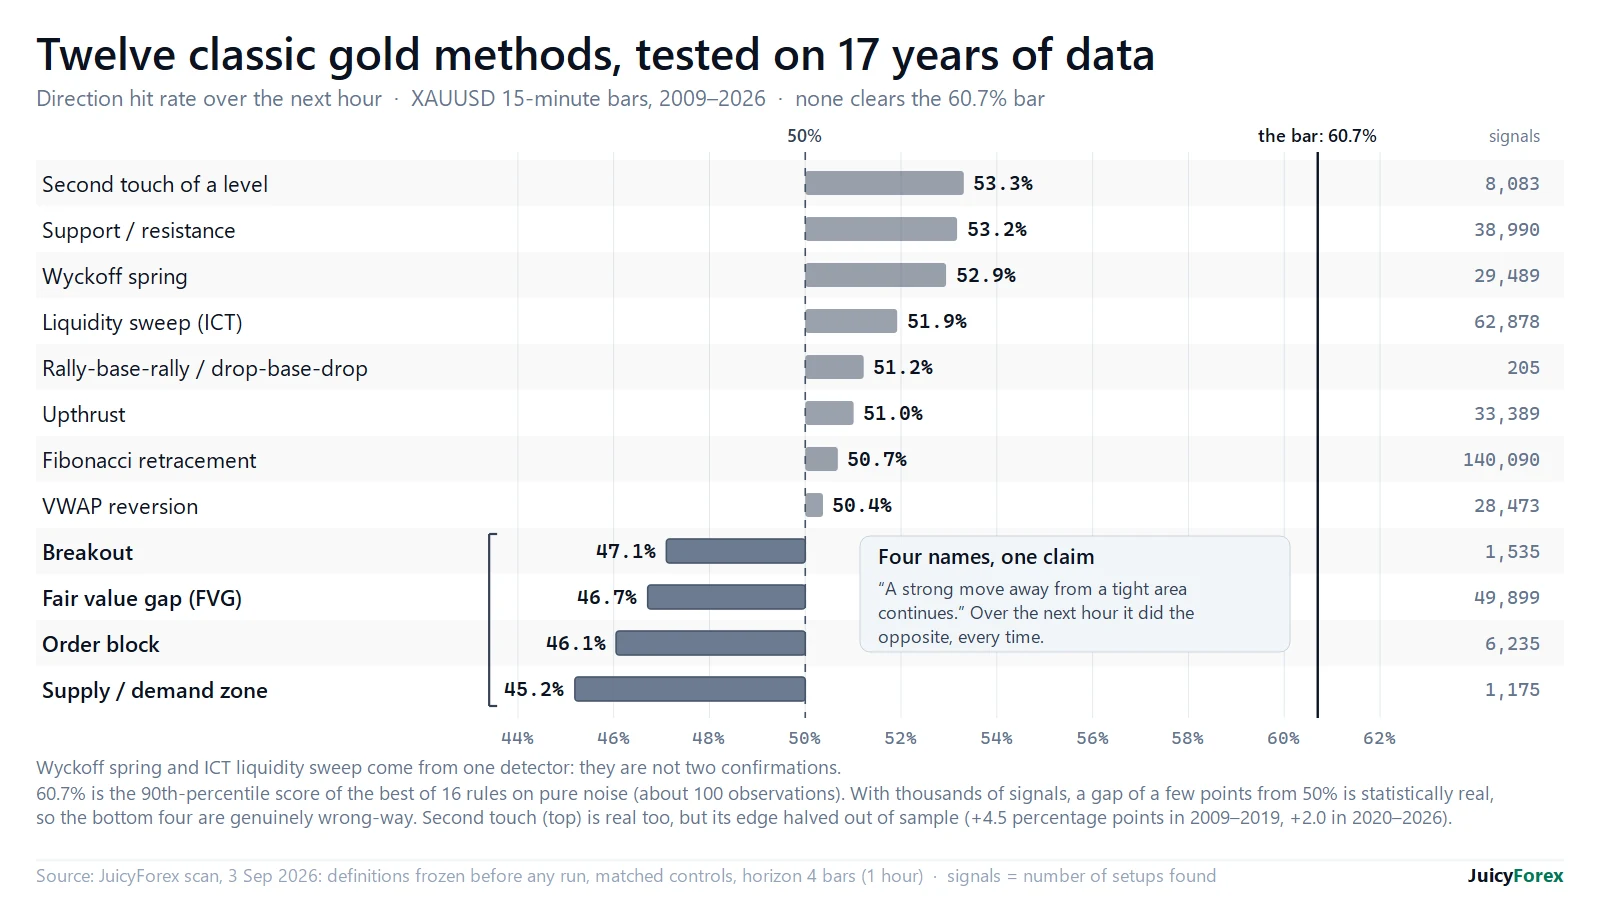
Four did worse than a coin: breakouts, fair value gaps, order blocks and supply/demand zones scored 45–47%, and the shortfall is statistically real. They are four names for one claim, that a strong move away from a tight area continues, and over the next hour it did the opposite. Second touch is the other side of the same coin: it replicated on the 2020–2026 holdout (51.9%) and beat 99.6% of shuffled controls, but its edge halved (+4.5 percentage points of hit rate in 2009–2019, +2.0 since), it did not survive a strict multiple-comparison test, and it is far too small to pay a spread on every entry. Real and tradeable are different tests; at best it passes the first. None of this means a discretionary trader cannot use these ideas; it means the mechanical versions, as defined, did not clear the bar at this horizon.
A Wyckoff spring and an ICT liquidity sweep come from one detector in our code, and their measured edges (+2.1 and +2.0 percentage points) differ by 0.15: one signal, not two confirmations. See our guides to order blocks, smart money concepts and ICT.
4. The edge that was the future leaking in
Our first cut of the liquidity-sweep scan reported an edge of +11 percentage points of hit rate at one hour, which would have justified trading it that afternoon. It was an artefact. The detector required price to close back inside the level within three bars, a fact from the future, yet stamped the signal at the start.
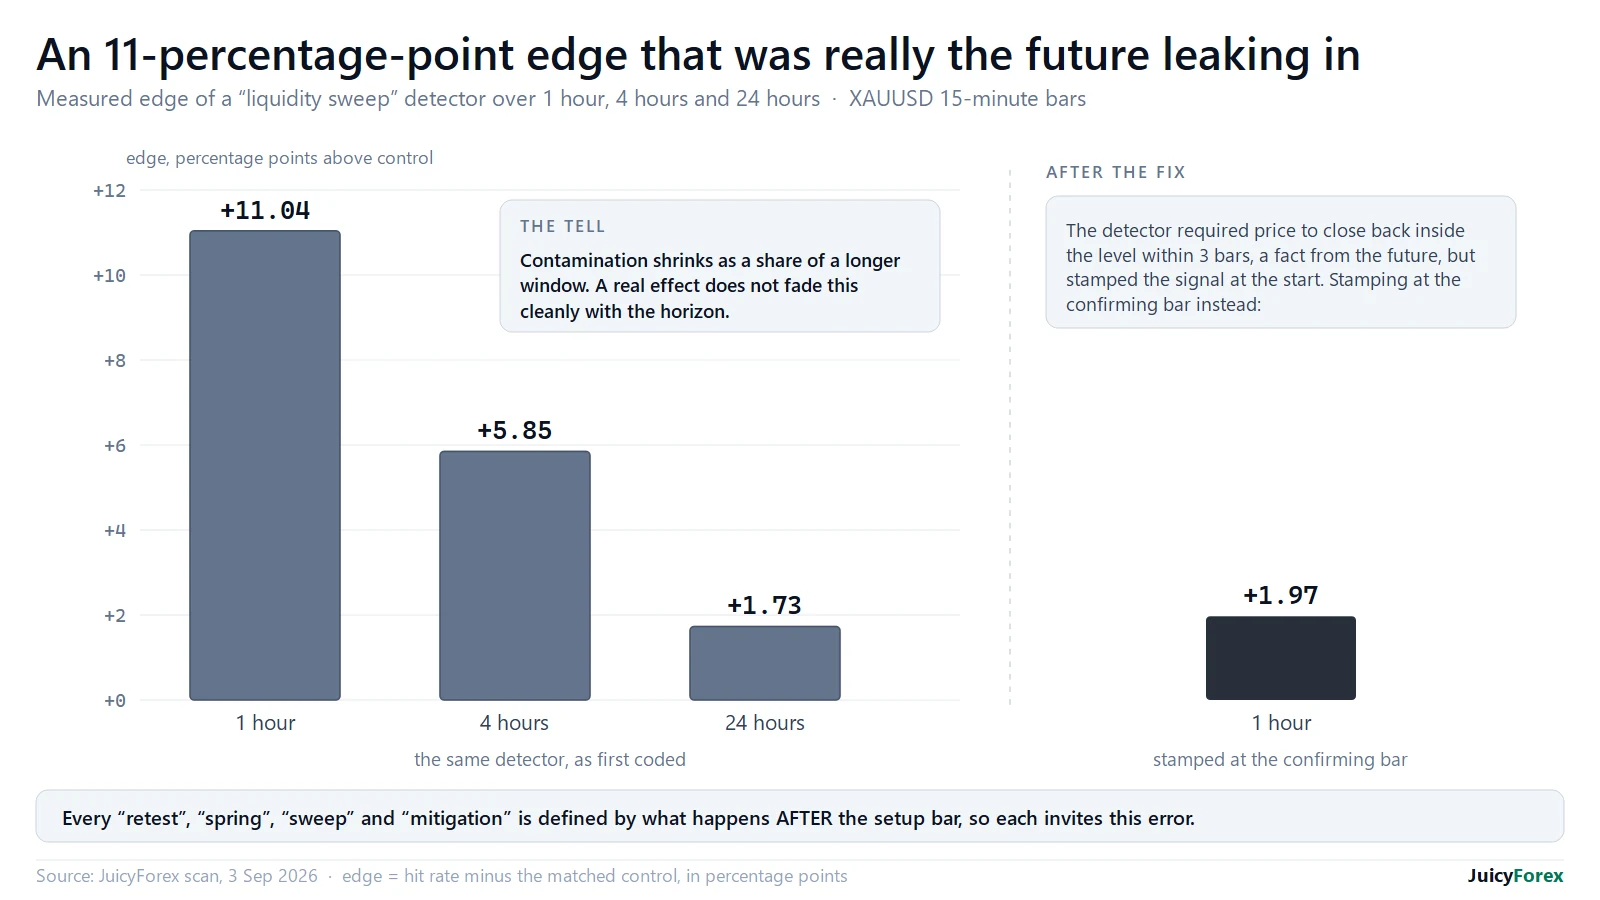
The tell was the decay: +11.04 percentage points at one hour, +5.85 at four, +1.73 at 24. That is contamination shrinking as a share of a longer window, not an edge fading. Stamping the signal when it was confirmed collapsed it to +1.97.
Every “retest”, “spring”, “sweep” and “mitigation” is defined by what happens after the setup bar, so each invites the same error. A backtest that cannot show, in code, why it cannot see forward is not a test.
5. Gold has fat tails
On 4,562 weekday sessions since 2009, a 2σ move came on 8.9% of days against 4.55% for a bell curve; a 3σ move on 2.2% against 0.27%; a 4σ move on 0.75% against 0.006%. In practice a 3σ day arrives about six times a year, not once every 17 months. (Sunday-evening sessions are left out: they last six hours, so they dilute every percentage.)
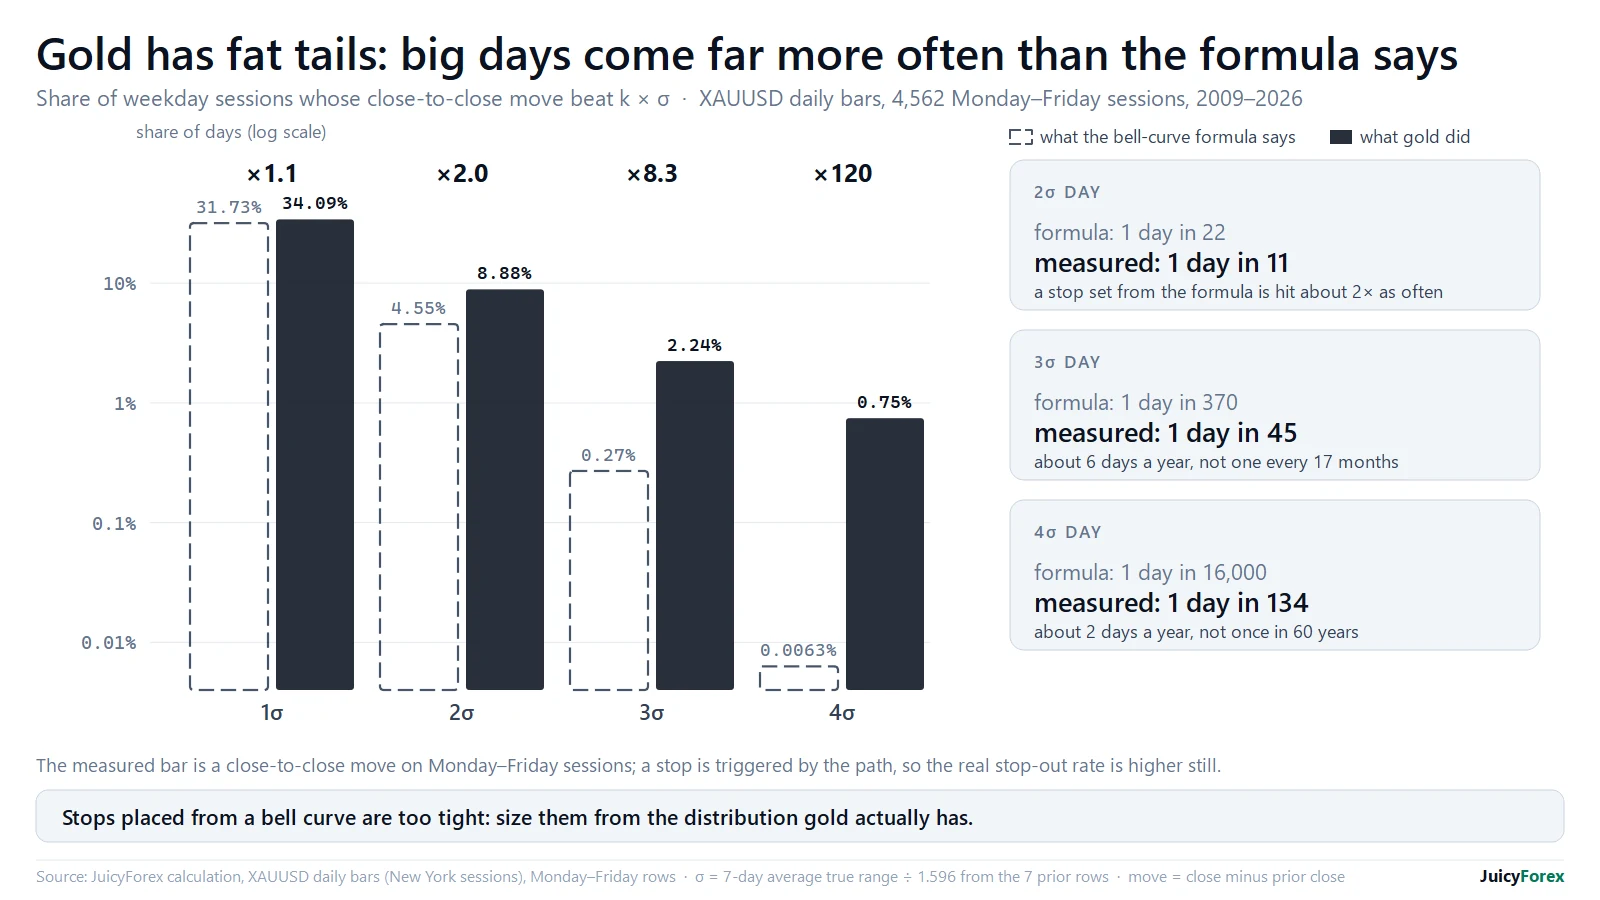
For stops the message is practical: a stop placed from the bell-curve formula is hit more often than planned. A 5% close-based stop-out rate needs about 2.4σ on weekday sessions (2.3σ counting every row), not 1.96σ, and a stop is triggered by the path rather than the close, so intraday spikes make it worse. Build the table on the instrument you trade: a multiplier measured on futures and applied to spot gold gave 1.1% stop-outs against a 5% target. See how to set a stop loss.
6. News is an hour, not a day
On US jobs, CPI and Fed days we compared gold’s range in each 15-minute slot with the same slot on normal days. The first 15 minutes after the print run 3.3× normal for jobs, 2.7× for CPI and 5.2× for the Fed decision, then fall back to about 1.1–1.2× normal by 90 minutes (the Fed stays loud for hours). CPI also quiets the tape just before the print: the slot before ran 0.86× normal.
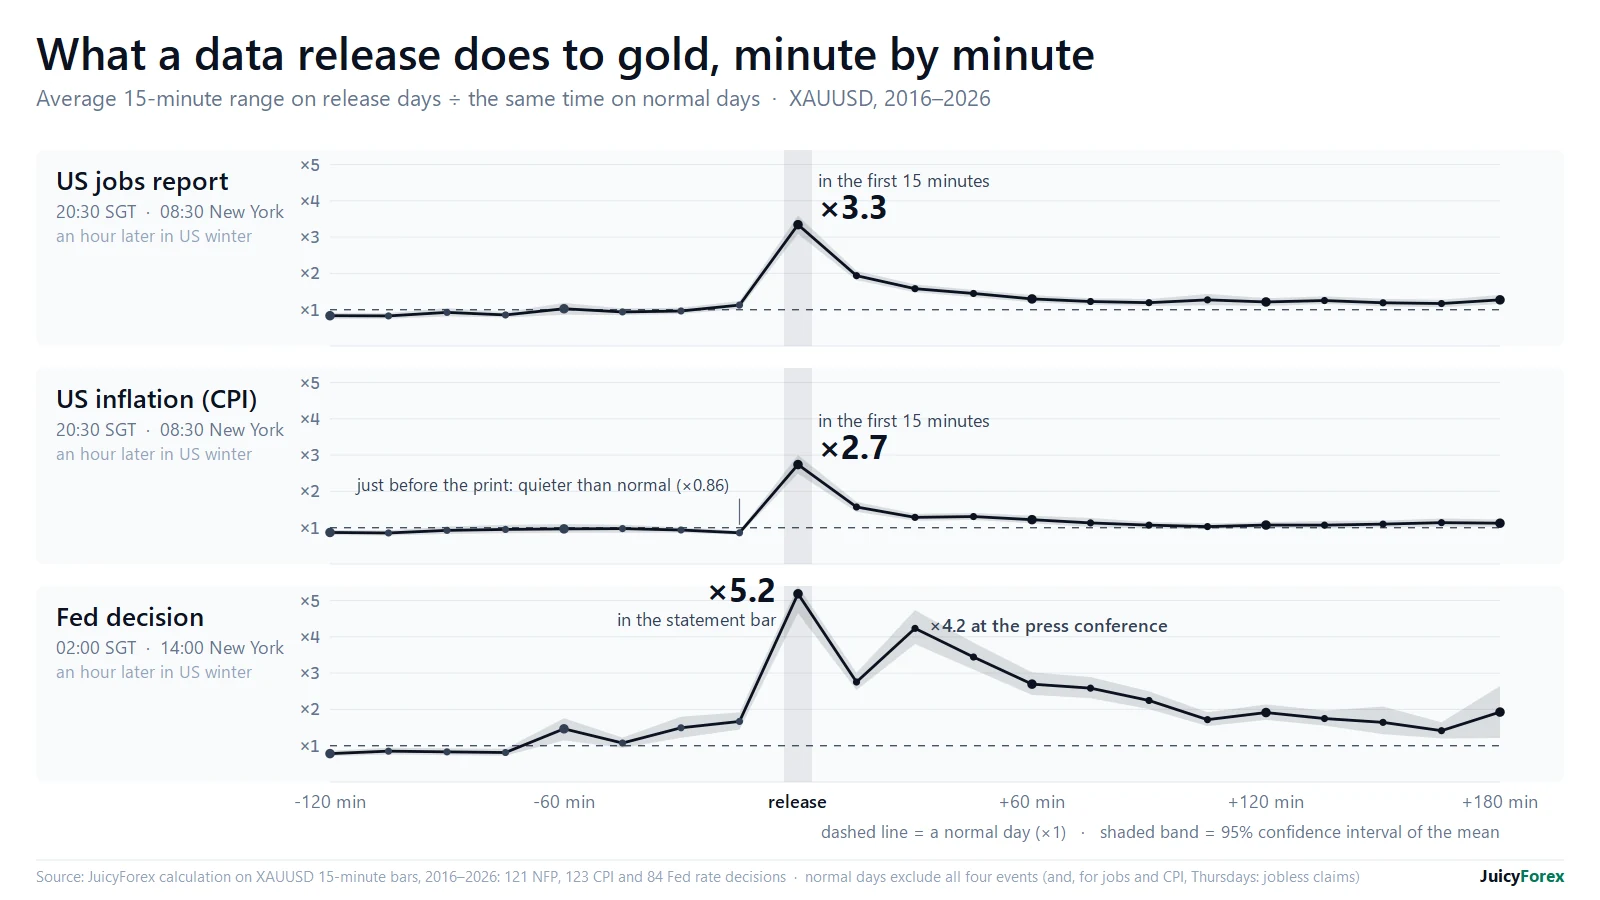
Over the whole session the picture shrinks: CPI and jobs days are only about 1.2× normal, the Fed day 1.4× and the day after a Fed decision 1.3× (Figure 7).
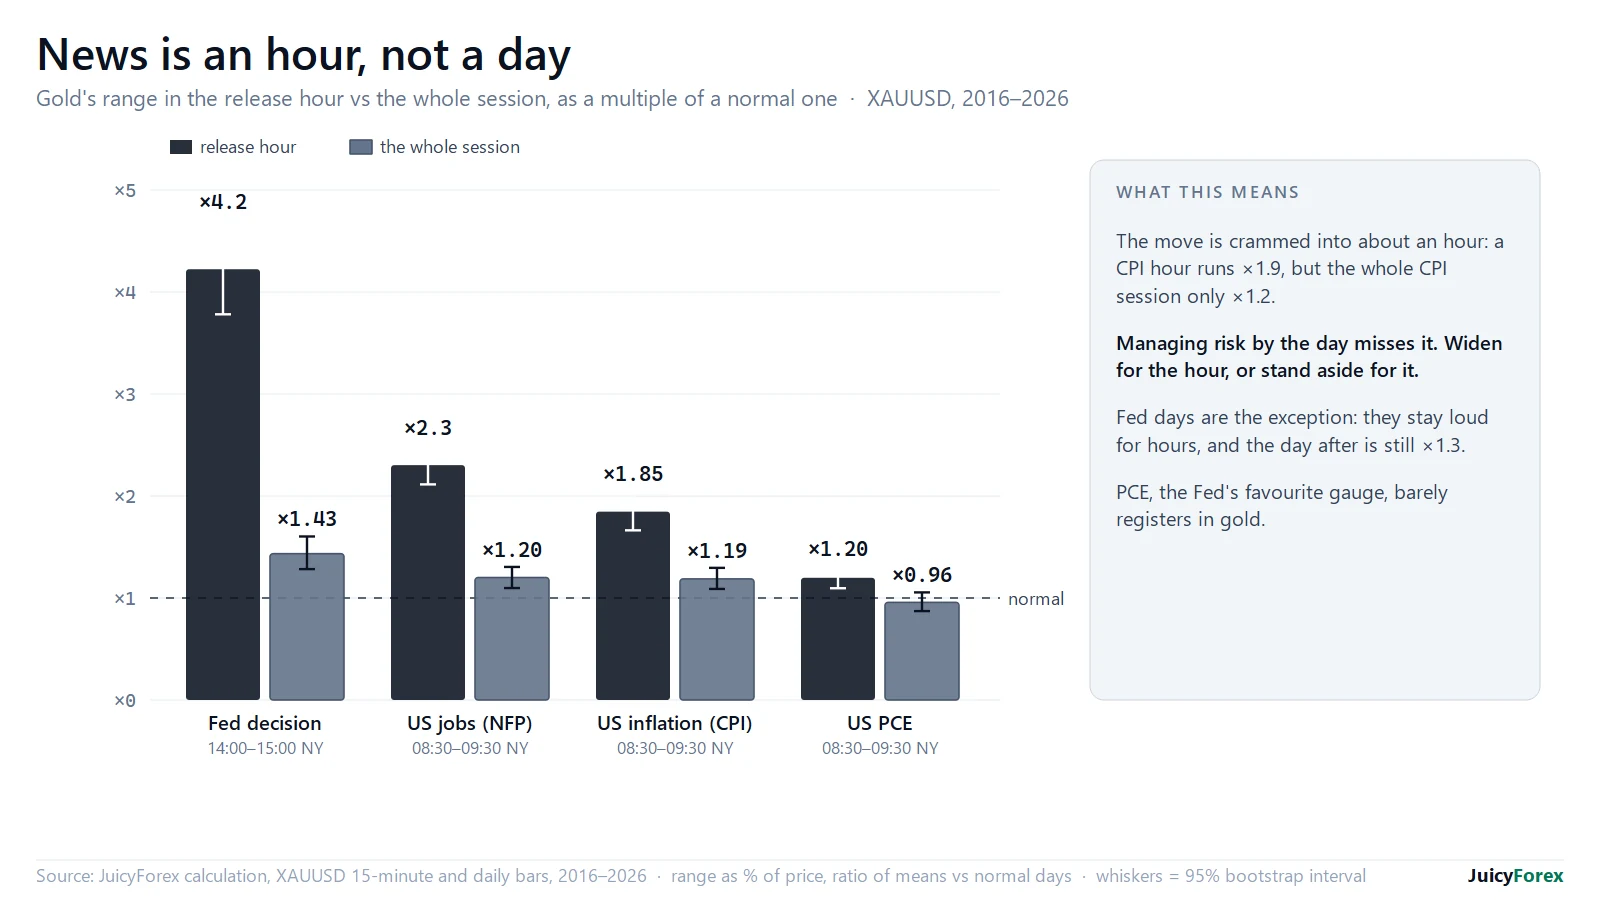
Size is not direction. The day after a Fed decision, gold moved more than 1.5σ on 31% of the 87 rate decisions since 2016, against 18% of all weekdays, and the big moves were split: 11 up, 16 down. News tells you how much, not which way.
Two lessons. Managing risk by the day misses the event: widen for the hour, or stand aside for it. And a study run on daily closes would have said “CPI does not matter”; it does, for an hour. Stops are hit by the path, not the close. See CPI, jobs and the Fed.
7. The Singapore evening is where the risk is
In Singapore time, 20:00–24:00 carries 35% of the day’s variance in 17% of the clock (26% by plain range), with 20:00, 21:00 and 22:00 the three busiest hours. Variance weights big moves more heavily, which is why it is the usual measure of risk. US data lands at 20:30 and the New York open at 21:30 in US summer time; in US winter the whole block moves one hour later. The sleep window, 00:00–07:00, carries 17.5% of the variance (21% by range), and a smaller peak sits at 09:00, an hour after the Asian open at 08:00.
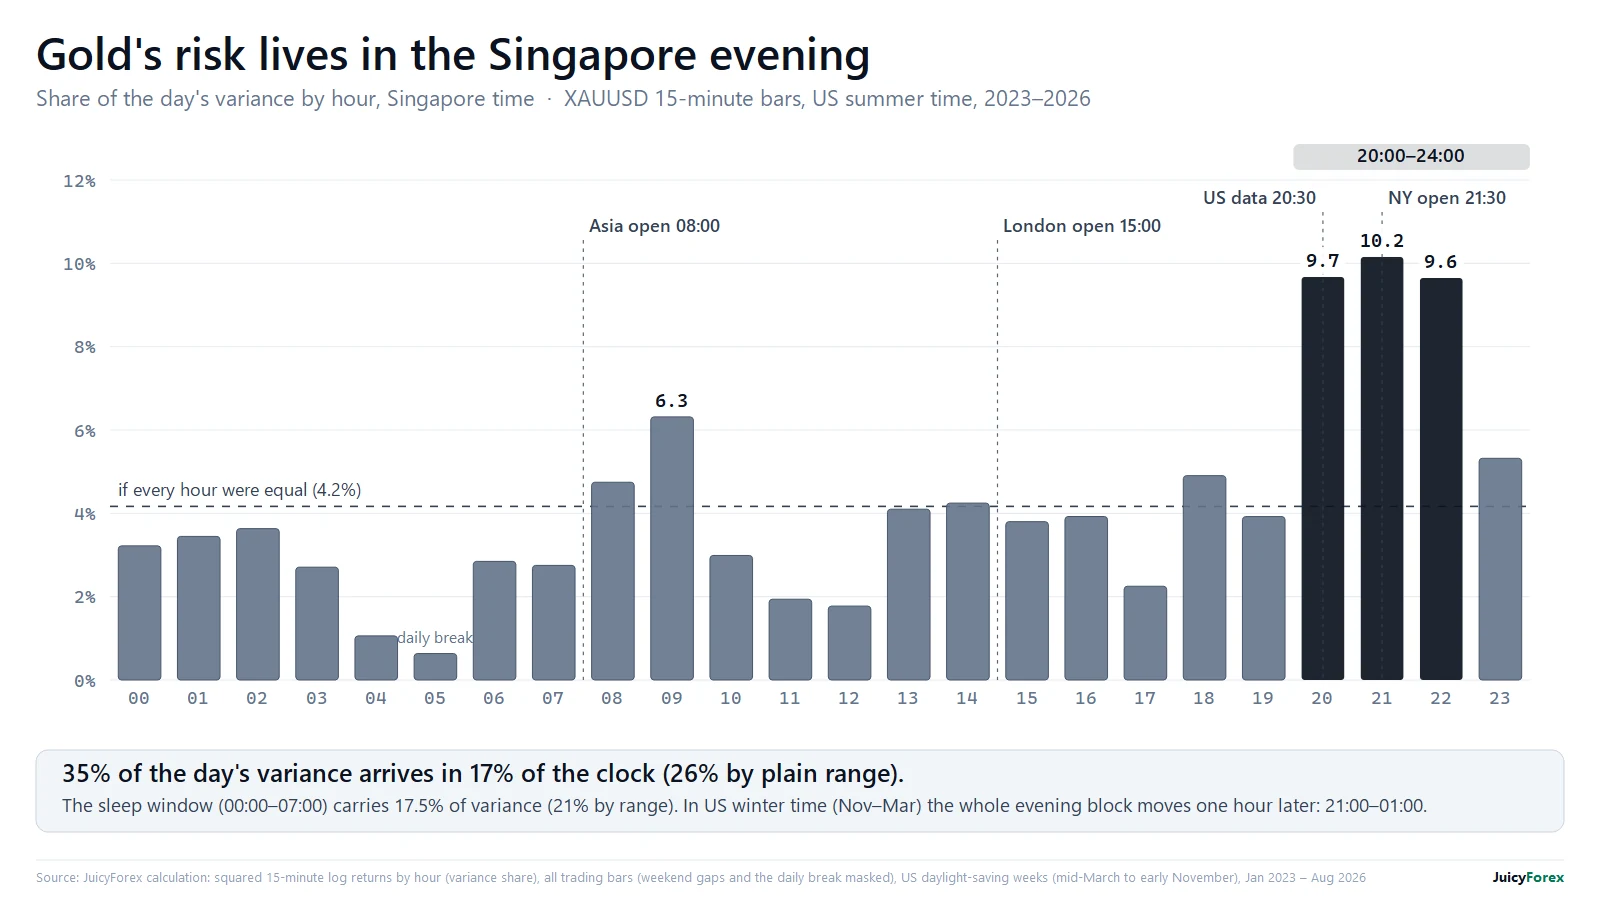
If you trade from Singapore, that evening block is where stops and position sizes need the most care, and where a resting order is most likely to meet a spike. See gold trading sessions.
8. Spreads are small, except for about five minutes
Measured on 4,999 15-minute bars from OANDA’s practice feed (16 June to 1 September 2026), the median gold spread was 0.60 points, the 90th percentile 0.78 and the 99th 1.10, with one bar in 4,999 above 4.00. Around releases it blows out, but only briefly: across seven releases the median was 2.22 points in the minute before the print, 0.84 at the print, and back to normal four minutes later. The median is widest before the number, not after, though the single widest reading, 6.47, came in the print minute itself; seven releases is a small sample.
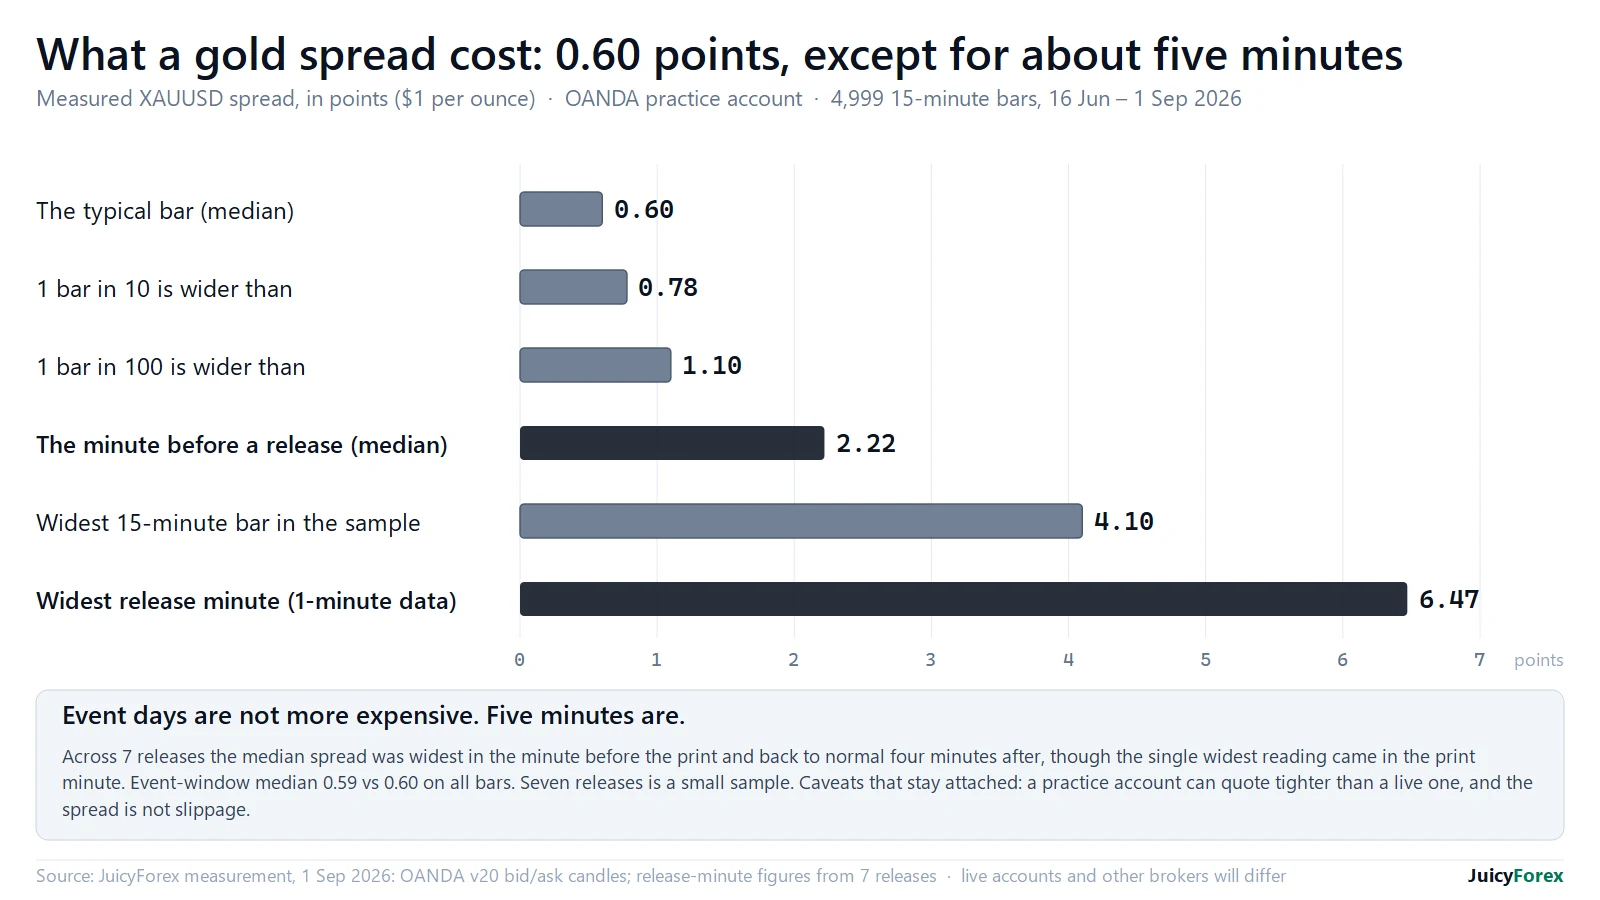
Event days are not more expensive on average (event-window median 0.59 against 0.60 overall); a few minutes around a release are. Two caveats stay attached: a practice account can quote tighter than a live one, and the spread is not slippage. See the spread guide.
9. Oil had the wrong sign
The textbook says oil is an inflation hedge and so good for gold. Over 125 sessions to 28 September 2026 the correlation of daily returns was negative at every window: −0.61 over 5 days, −0.44 over 10, −0.38 over 20 and −0.37 over the whole sample. The 5- and 10-day figures rest on 5 and 10 daily returns, so lean on the whole-sample number. Gold averaged −0.35% on days oil rose and +0.29% on days oil fell.
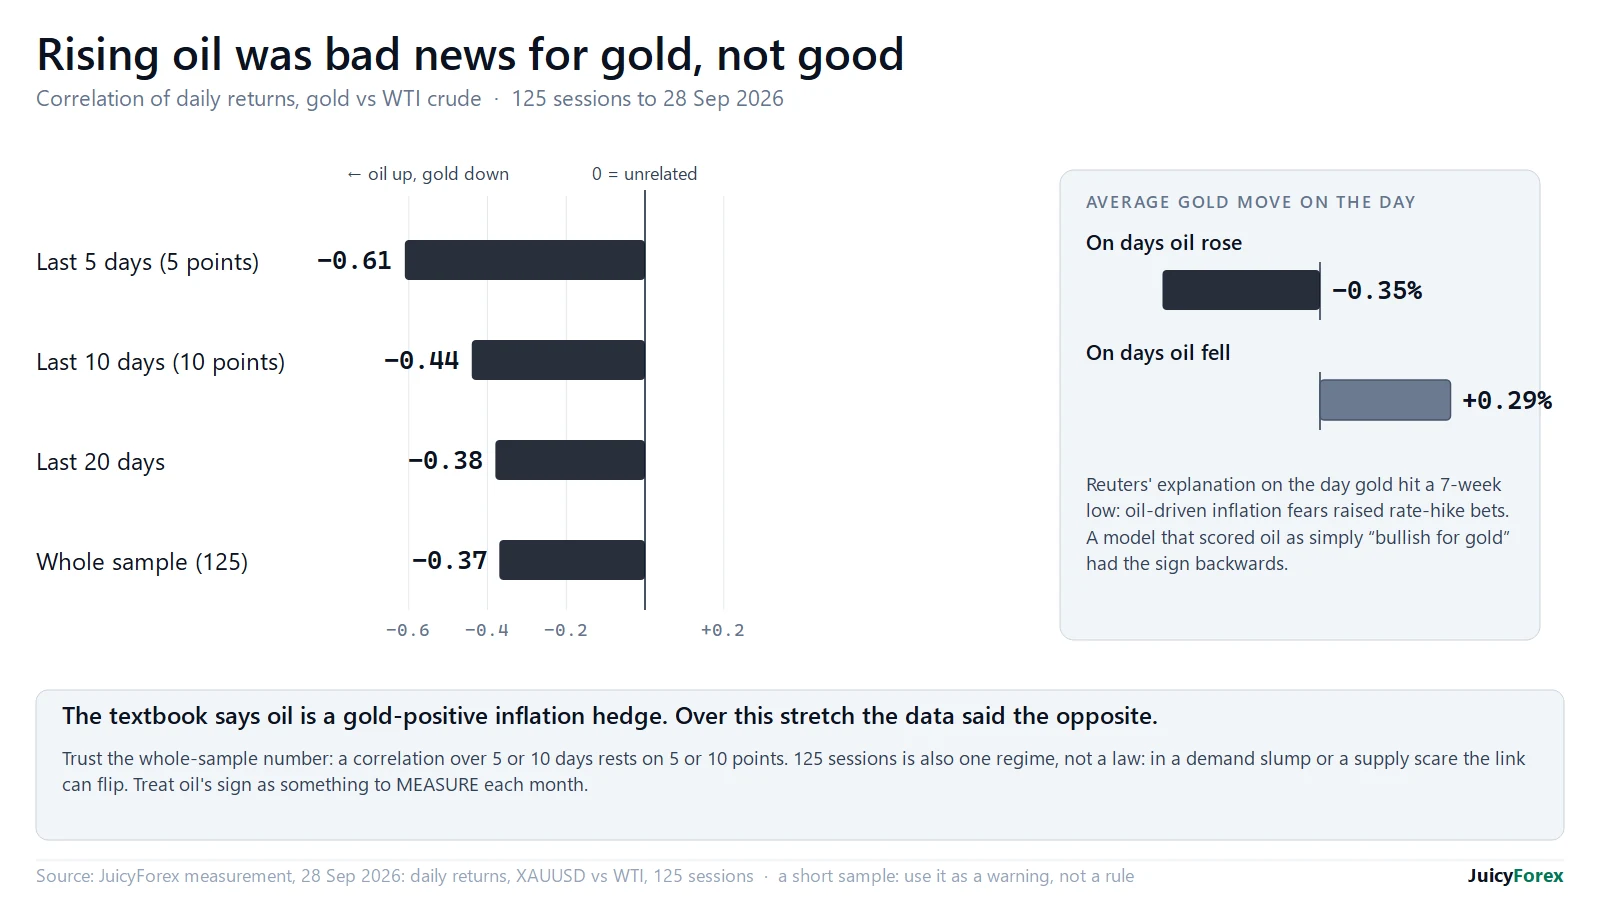
Reuters’ headline on 28 September blamed oil-driven inflation fears and rate-hike bets for gold’s slide, the opposite of the textbook chain. That day a model that scored oil as bullish for gold read bullish while gold fell 140 points to a seven-week low; with oil’s contribution removed its verdict was neutral. 125 sessions is one regime, not a law, so measure the sign before you rely on it. See what moves gold.
10. The mistakes we nearly published
The most useful part of the work was the errors. Each one below reached, or nearly reached, a published map or report before it was caught, and each became a rule.
| What went wrong | What happened | The rule we kept |
|---|---|---|
| Scored an in-line CPI as bearish | On 12 August 2026 a CPI print that matched forecasts was scored net-bearish for gold, targeting 4,342–4,352. Gold went the other way and was at 4,435 afterwards, about $88 above the target. | Score each release against both the forecast and the previous print; an in-line print scores zero. |
| Probabilities from zone counts | On 13 August a published ladder put 4,335 under 5% and 4,316 under 1%. Gold traded 4,311.04. | Compute reachability from distance ÷ realised range, and nothing else. |
| Zones too narrow | On 18 August zones $1.40 wide were drawn on an instrument with a daily σ of about $52. | Size zones from volatility, not from an indicator’s default box. |
| A high cited as a low | On 24 August an audit found a published level, cited as a low, was really a high. | Check every cited price against the data, including whether it is a high or a low. |
| The wrong clock | Our 15-minute cache is New York local time, not UTC. Read as UTC, it put US releases hours out and made CPI look like 1.0× normal. | Carry a control that must reproduce a known result; it caught this one. |
| Three volatilities that disagree | Three daily-bar definitions (midnight New York, the 18:00 New York session boundary and a broker’s daily bars) gave a 7-day σ of 59.0, 65.5 and 68.0 on 21 August: up to 15% apart. | Never convert σ multiples to points using a different series. |
| A change nobody reverted | After one map failed, the distance rule was switched from σ-sizing to a multiple of the session’s 90th-percentile bar range and stayed that way. Zones sat further out than before; the last two before it was caught were the two least reachable buy zones published (16% and 20%) and never came within 34 points. | If a map prices below about 40% for one session, suspect the screen before the market. |
None of these is exotic. They are what happens when you analyse a noisy market in good faith without a check that can fail. See our corrections log for the errors on this site.
How we try not to fool ourselves
- Matched controls. Every signal is compared with the same measurement on a control, so a market drift is not mistaken for an edge.
- Definitions frozen first. Rules are written down before any run, and a held-out period is examined once.
- A control that must reproduce a known answer. It caught the clock error above.
- Measure on the instrument you trade. Methods transfer between instruments; numbers do not.
- Publish the failures. The record above is the proof that the process is allowed to say no.
Method and data
Frequently Asked Questions
Do these results mean technical analysis does not work?
No. They say the mechanical versions of twelve popular concepts did not clear a 60.7% hit rate on 15-minute gold over the next hour: four pointed the wrong way and the best had a real but tiny edge. A discretionary trader who reads context, sizes risk and manages exits is doing something different, which we have not tested.
What is the luck ceiling?
With about 100 test observations and 16 rules to choose from, the best rule on pure noise reaches 60.7% at the 90th percentile. A hit rate below that is indistinguishable from luck. With thousands of observations luck's ceiling is far lower, which is why the larger scans can detect small real effects.
Why use σ instead of a fixed number of dollars?
Because gold's volatility ruler (σ) changed from about 247 points on 5 February 2026 to 36 in October. A distance in σ means the same thing in both; a distance in dollars does not.
Is gold's spread really only 0.60 points?
On OANDA's practice account over 4,999 15-minute bars from June to September 2026 the median was 0.60 points. A live account, another broker or a quieter hour can differ, and the spread is not slippage.
Is any of this financial advice?
No. It is a record of what we measured and the mistakes we caught. Trading CFDs on margin carries a high level of risk.
70–80% of retail investor accounts lose money trading CFDs. This page is education, not advice. All trade examples are constructed composites.