
A zone map turns a chart into a few conditional statements: a band of price, how far it sits from now in units of volatility (σ), how often a level that far away has been reached before, and the close beyond which the idea is void. It never says price will go there. This page takes one real map, shows what happened next and explains each number. Every map here has expired; this is structural analysis, not a signal.
What a zone map is, and what it is not
Most gold charts show levels as lines with a story attached: “strong support at 4,150”. A zone map is stricter. For every level it states three things in advance:
- Where. A band of price, not a single line, with the level that matters marked at its far edge.
- How likely. How often a level this far from price has been reached within a session, measured on 10,856 historical cases.
- When it is wrong. A close beyond which the zone is void.
It is not a forecast and it is not a signal. A map describes conditions; it does not say price will go to a zone, and it does not tell you what to do if it does. We show maps only after they have expired, as worked examples of a method you can apply to any chart. How we handle real data and maps.
Anatomy of a real map
Figure 1 is the map our process produced at 21:00 Singapore time on Friday 16 October 2026, with gold at 4,166.77. It has two zones, one either side of price. Read it in this order:
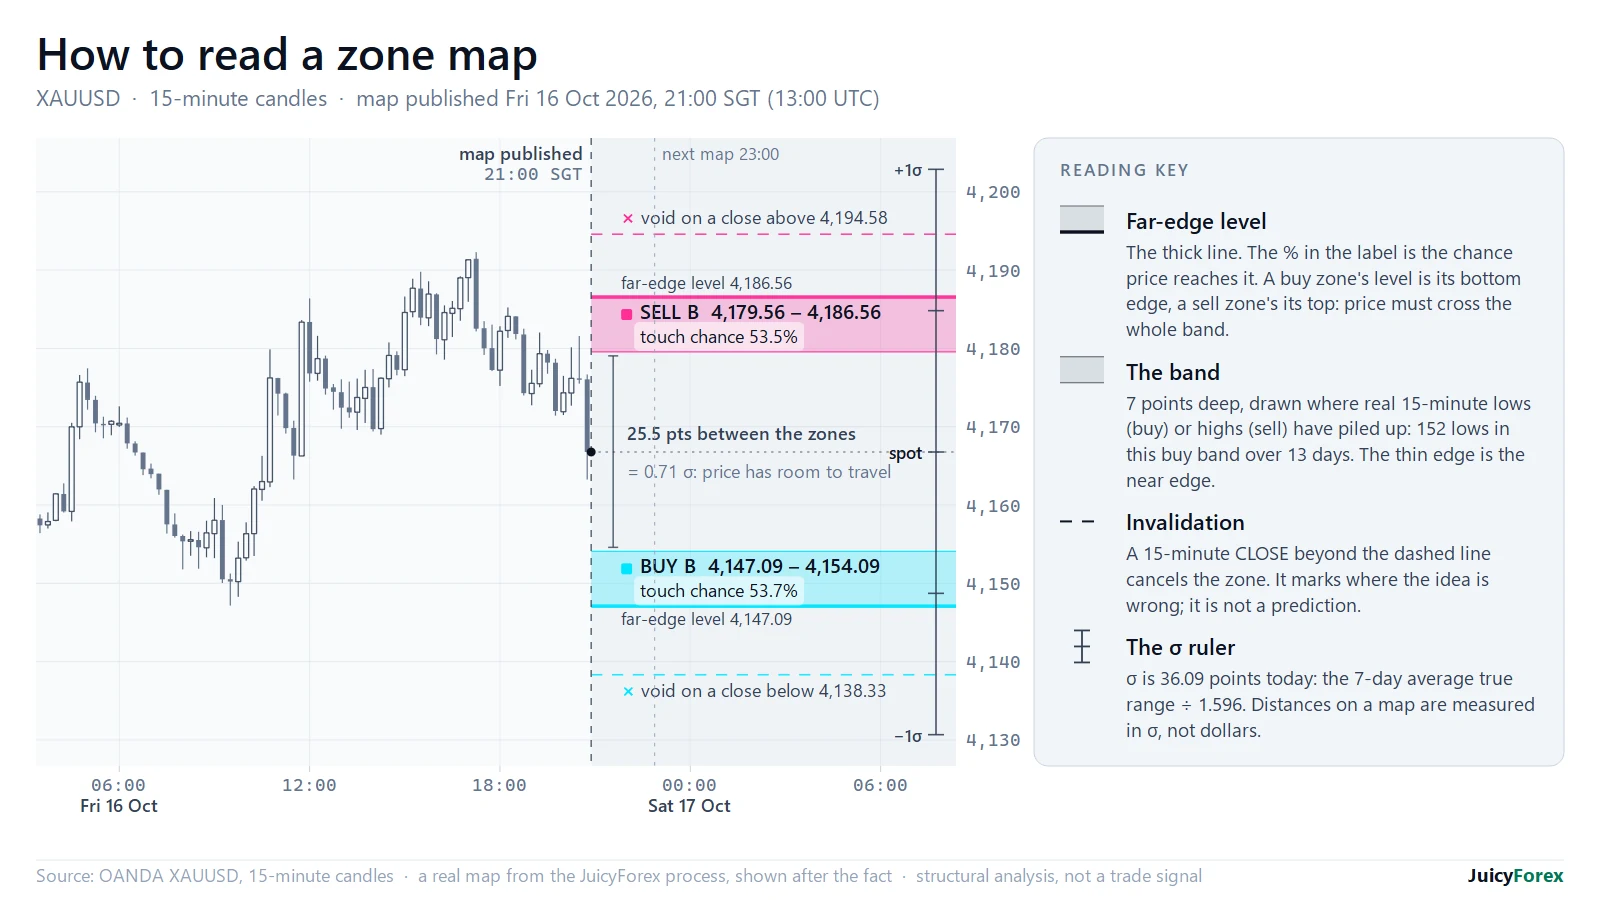
- The far-edge level. A buy zone’s level is its bottom edge and a sell zone’s its top. We measure the chance of reaching the level, not just touching the band, because crossing the whole band is the harder test.
- The band. Seven points deep, drawn where real 15-minute lows (for a buy) or highs (for a sell) have piled up: 152 lows in the buy band over 13 days, 127 highs in the sell band over 11.
- The touch chance. 53.7% for the buy and 53.5% for the sell. Both levels sit 0.55σ from price; the next sections explain what that means.
- The invalidation line. A 15-minute close below 4,138.33 voids the buy; a close above 4,194.58 voids the sell. Each line sits 8 to 9 points (0.22–0.24σ) beyond its level, on the densest cluster of real lows or highs there (95 and 59 prints within 2.5 points), not at a round number.
- The gap between the zones. 25.5 points (0.71σ). A map leaves room for price to travel; it does not try to cover it.
The ruler is volatility, not dollars
Gold’s range is not constant. The same calculation that gives 36 points today gave about 247 in early February 2026, after the January peak. A fixed $10 zone means almost nothing in one regime and everything in the other.
So every distance on a map is measured in σ (sigma): the average true range of the last seven daily sessions, divided by 1.596. The 1.596 is the ratio of an average range to a standard deviation for a random walk. Figure 2 builds it from seven real days.
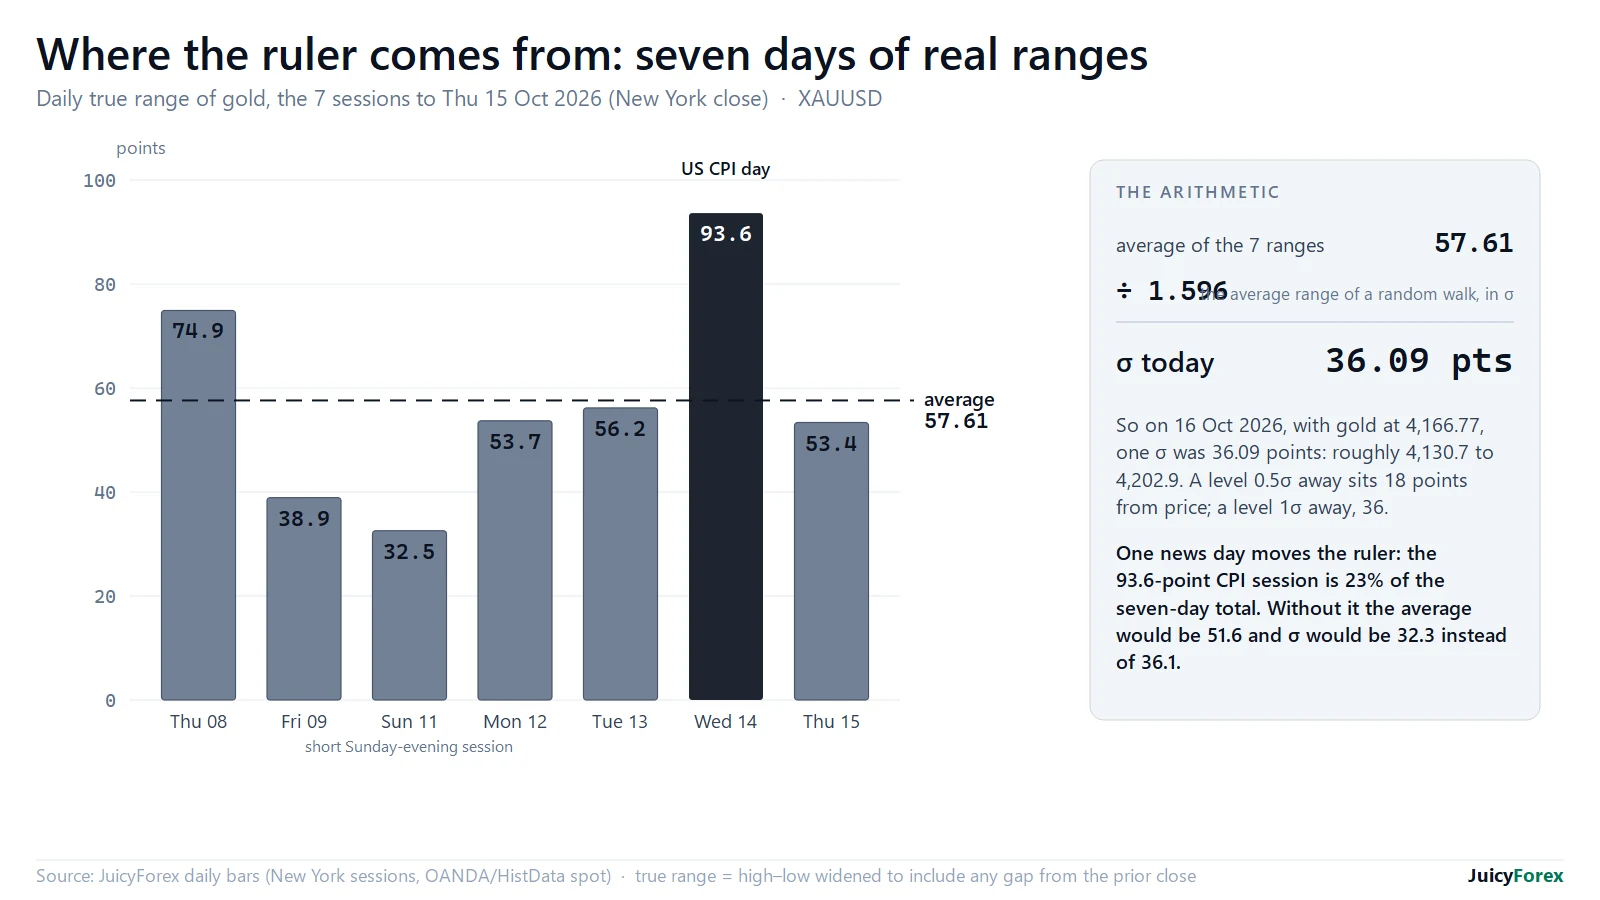
One event day moves the ruler. The 93.6-point CPI session on 14 October is 23% of the seven-day total; without it σ would be 32.3 instead of 36.1.
How likely is a level to be reached?
Once distances are in σ, the probability can be measured instead of guessed. We took every daily session from March 2009 to 2 September 2026, set a level k·σ above and below the prior close, and counted how often the next session’s high or low reached it: 10,856 levels in all.
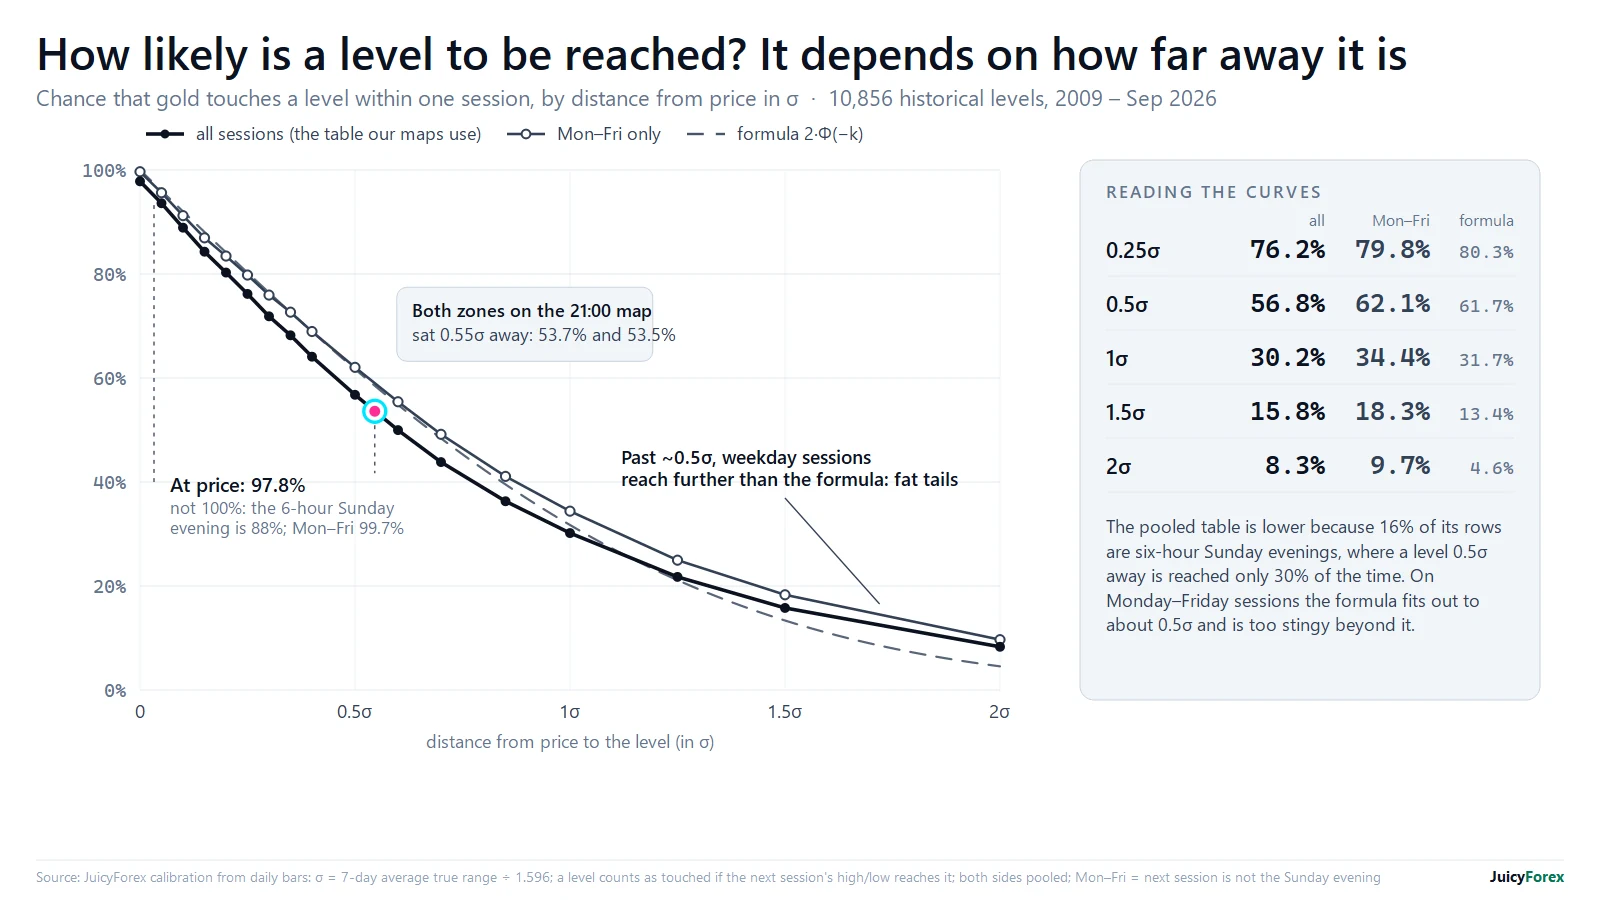
Three things stand out. First, a level exactly at price is touched 97.8% of the time, not 100%. Almost all of the shortfall is the short Sunday-evening session: in 23% of those, price opens away from Friday’s close and never comes back to it, against 0.7% of Monday–Friday sessions. Second, the table pools every session, Sunday evenings included, so it understates a weekday: at 0.55σ it says about 53.5%, while Monday–Friday sessions alone reached such a level about 59% of the time. Third, beyond about 0.5σ weekday sessions go further than the textbook formula allows, consistent with gold’s big days being far more common than a bell curve says (see the fat tails).
We rebuilt this table from the raw daily bars for this page, with the same construction, and it matches our shipped calibration to within 0.01 points. That checks the arithmetic, not that gold will keep behaving this way. The two zones on Figure 1 sit at 0.545σ and 0.548σ, which the table puts at 53.7% and 53.5%: the numbers printed on the labels.
Why a band, not a line
A single price is a hard target. With the level 0.3σ below the close, a bare line was touched in 71% of the next sessions. Give the same level a band 0.2σ deep and it was touched in 88–90%; at 0.3σ deep, 97–98% (Figure 4). Like the touch table, these rates pool every session, Sunday evenings included, so weekday-only rates are somewhat higher.
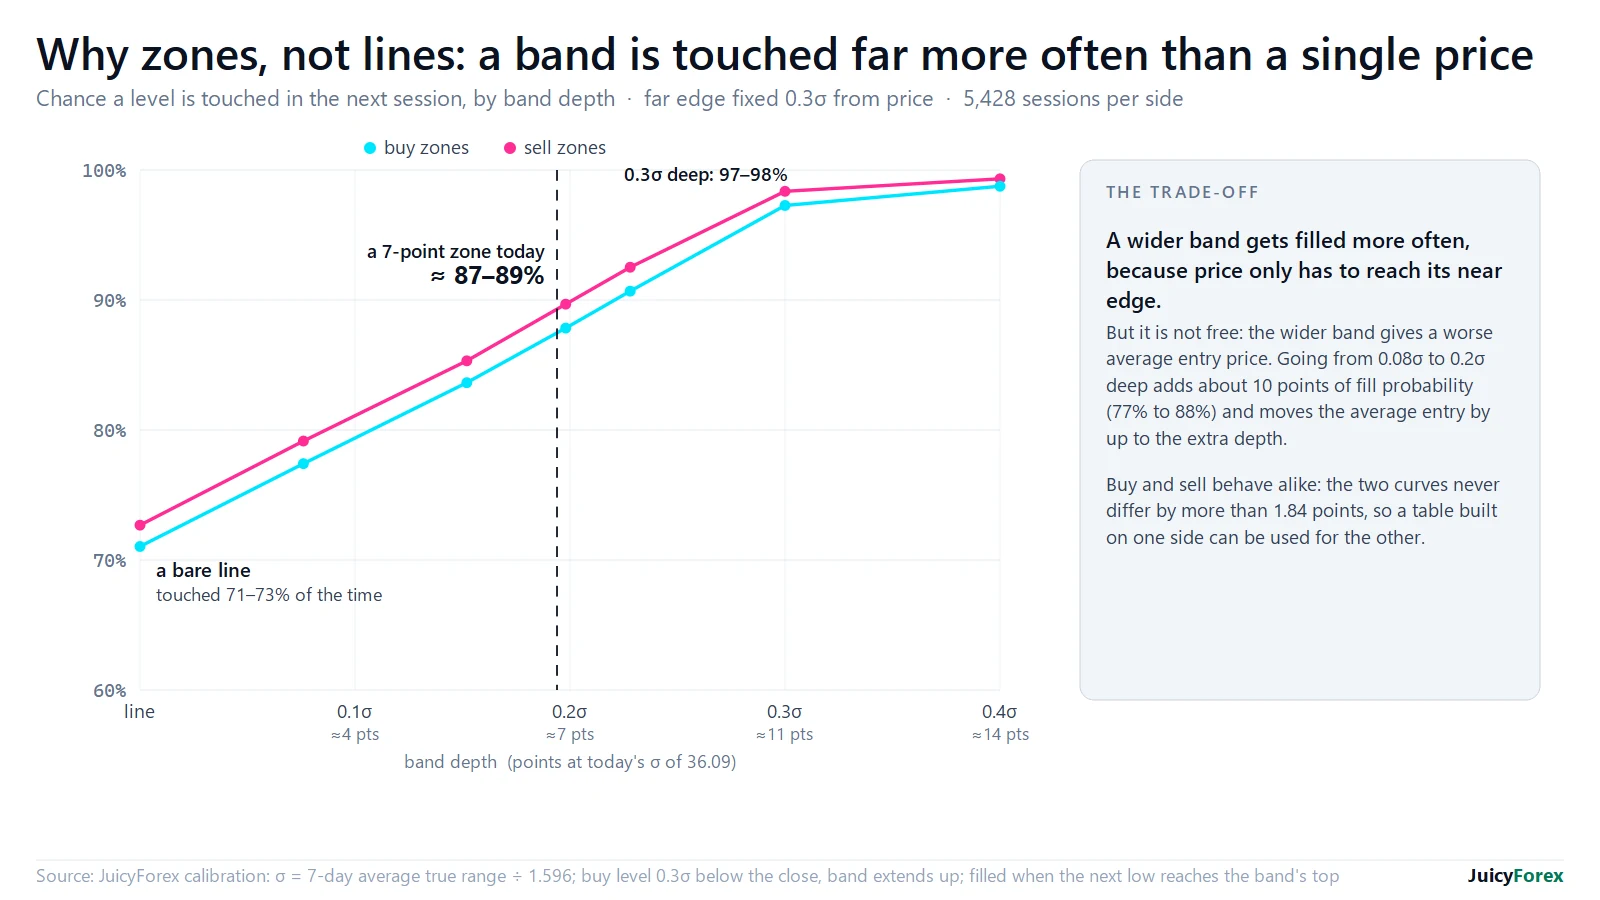
The cost is the entry price: the wider the band, the worse the average fill. A band is a trade-off you choose, not a free lunch. It is why our support and resistance guide says to draw zones, not lines.
What happened next
A map is only useful if you score it afterwards. We score each one from the moment it is published until the next map replaces it or it expires. A zone is reached when price trades at its near edge, traversed when it then trades through to the far-edge level, and voided when a 15-minute candle closes beyond the invalidation line.
Figure 5 is the same 21:00 map. Thirty minutes later the sell zone was reached, and 15 minutes after that it was traversed. The candle that opened at 22:15 then closed (at 22:30) above 4,194.58, so the zone was voided; price fell 15 points from its peak, to 4,184.06, before the next map. The buy zone missed by 0.73 points.
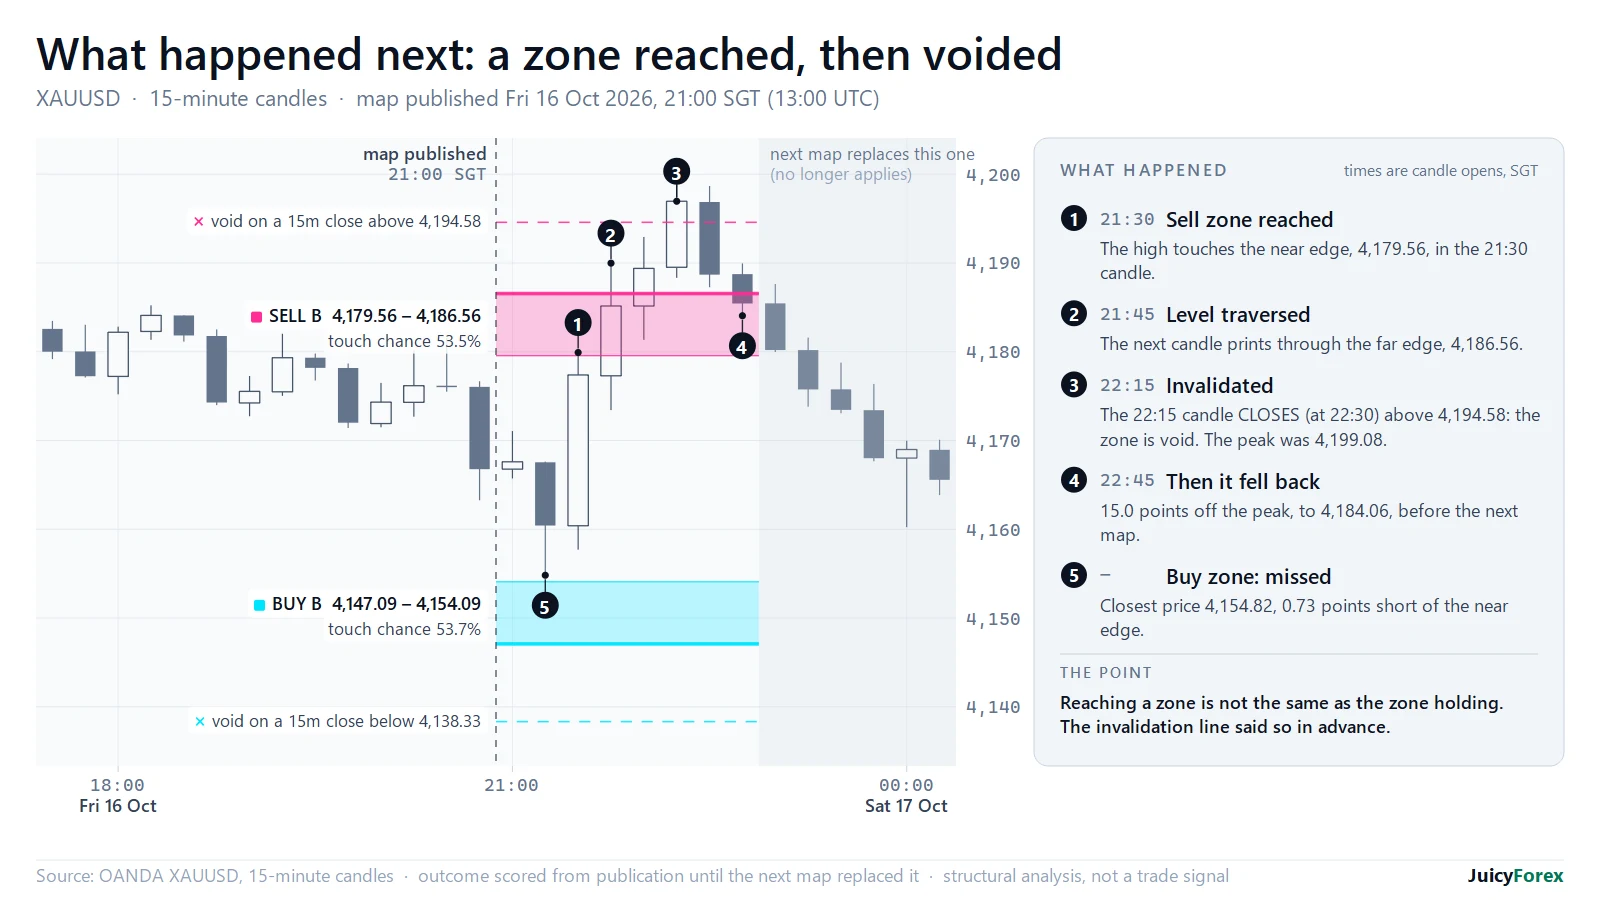
Figure 6 is the next map, published at 23:00. Its buy zone was reached in the 23:45 candle and price traded 4.8 points through the level, but no candle closed beyond the invalidation line, so the zone stayed valid.
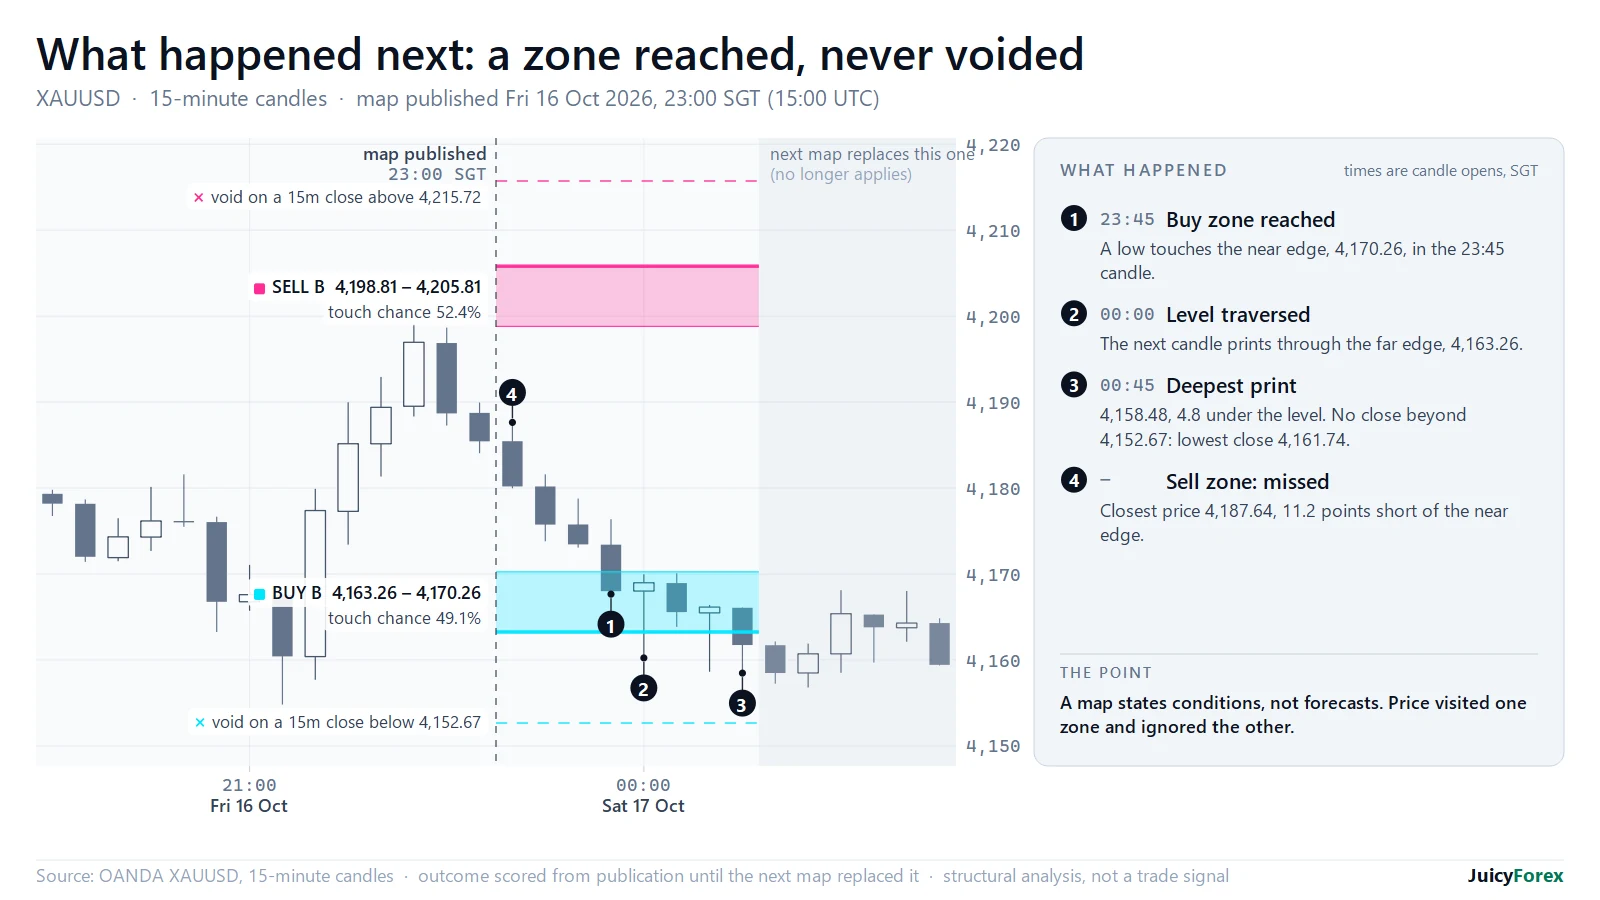
Neither outcome could have been known in advance, which is the point. A zone map states conditions; the invalidation line states what would prove it wrong before the session begins.
What the record shows, and what it cannot
Across 14 maps and 26 zones between 13 and 17 October 2026, five zones were reached and went on to trade through their far level (one of them was later voided), and 21 were never reached, ten of those by under five points. Three of these results carry a note. The full archive explains them and shows every map we can score and its outcome.
That is a record of behaviour, not a track record. The sample is far too small, the maps lived from 40 minutes to four hours against a touch chance measured over a full session, and nothing here includes costs or fills. It is also not evidence of skill: with this few observations luck alone can produce almost any hit rate, as we show here.
How to use a map without trading it blindly
- Direction first, levels second. A zone map says where, not which way. Start from the drivers: real yields, the dollar and the event calendar.
- Respect the calendar. A high-impact release inside a map’s horizon voids it. News is an hour, not a day: see the data.
- Size from the stop. The invalidation line is where you are wrong, so your position size comes from the distance to it, never the other way round.
- Score your own maps. Write the levels, the distance in σ and the horizon down before the session. Without a record you will remember the hits.
This is education, not advice.
Method and data
Frequently Asked Questions
What is σ (sigma) on a gold zone map?
σ is a volatility ruler: the average true range of the last seven daily sessions divided by 1.596. On 16 October 2026 it was 36.09 points. Distances on a map are measured in σ so they mean the same thing in a quiet week and a wild one.
What does a touch chance of 53.7% mean?
Across 10,856 historical cases from 2009 to September 2026, a level 0.55σ from the prior close was reached by the next session's high or low about 53.5% of the time (about 59% counting Monday–Friday sessions only, because the table also includes the short Sunday evening). It is a measured frequency over one session, not a prediction for this particular level.
Why is the level at the far edge of the zone?
Because it is the harder test. Price can touch the near edge of a band without really engaging it; reaching the far edge means it crossed the whole band. We state the chance of that, and put the invalidation line beyond it.
Are these trade signals?
No. They are structural analysis shown after the fact. They do not say price will go to a zone, which way to trade it or how large to trade, and a map on this page is never a live trade signal.
Can I draw a zone map myself?
Yes. Compute σ from the last seven daily true ranges, pick levels where real 15-minute lows or highs have clustered, size the band at about 0.2σ, mark the far edge, put the invalidation line about 0.2σ beyond the level, on the densest cluster of real lows or highs there, and read the touch chance off the curve in Figure 3. Then write it down and score it afterwards.
70–80% of retail investor accounts lose money trading CFDs. This page is education, not advice. All trade examples are constructed composites.